Connect Power BI
This guide shows how to connect Power BI Desktop to the Parquet data imported by the Azure Function, create data tables, set up relationships, and build visualizations. Choose the section matching your deployment path.
Option A: Connect from OneLake (Lakehouse)
Prepare Lakehouse Tables
Before Power BI can use the data, convert the raw Parquet files in your Lakehouse into tables.
Go to https://app.fabric.microsoft.com/ and open your Workspace → Lakehouse
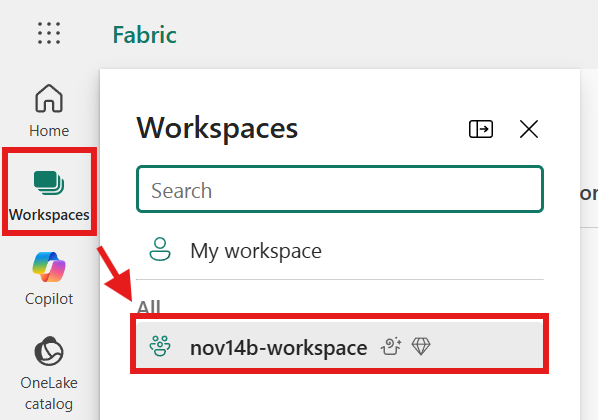
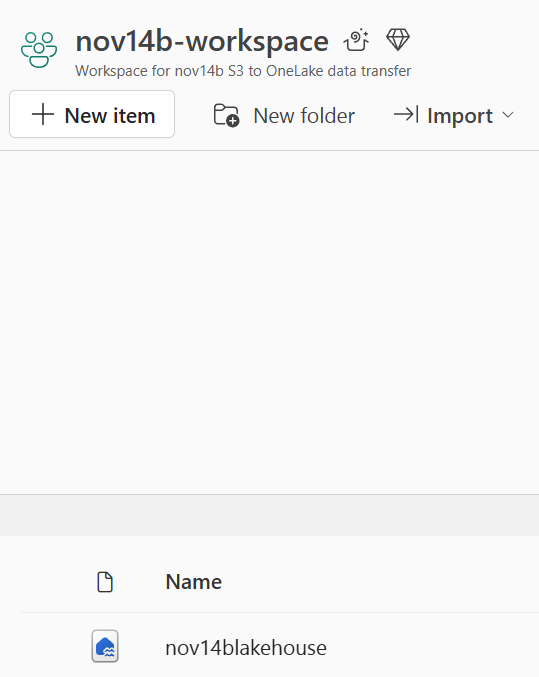
Select the Lakehouse from the workspace
In the Files section, right-click the
devicefolder → Load to Tables → New Table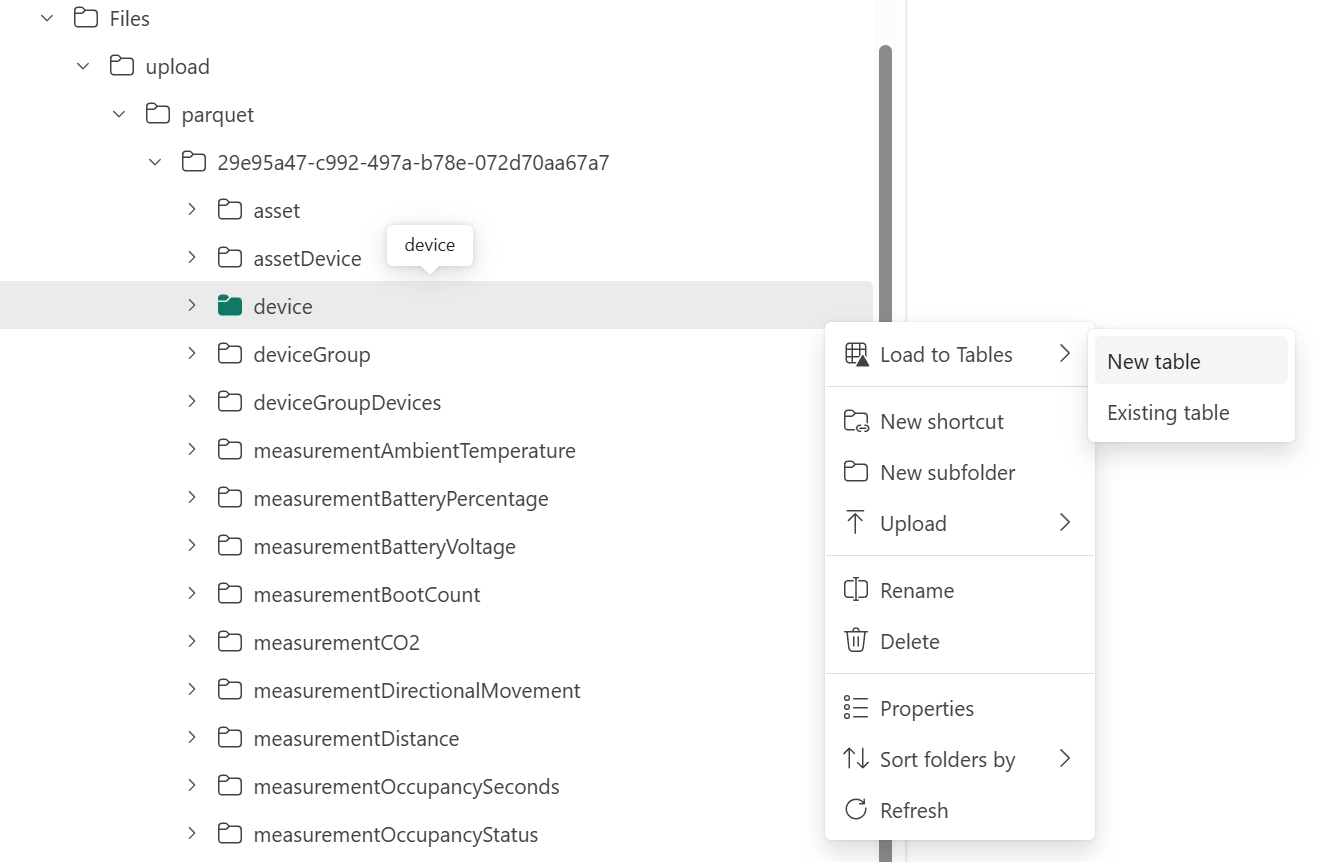
Set table name to
device, file type to Parquet, and click Load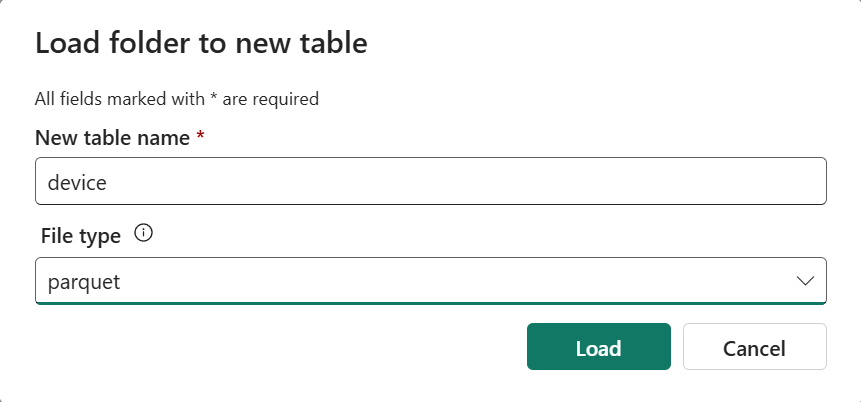
Repeat for each measurement table:
measurementCO2measurementOccupantsCountmeasurementOccupancyStatus
Connect Power BI Desktop to Lakehouse
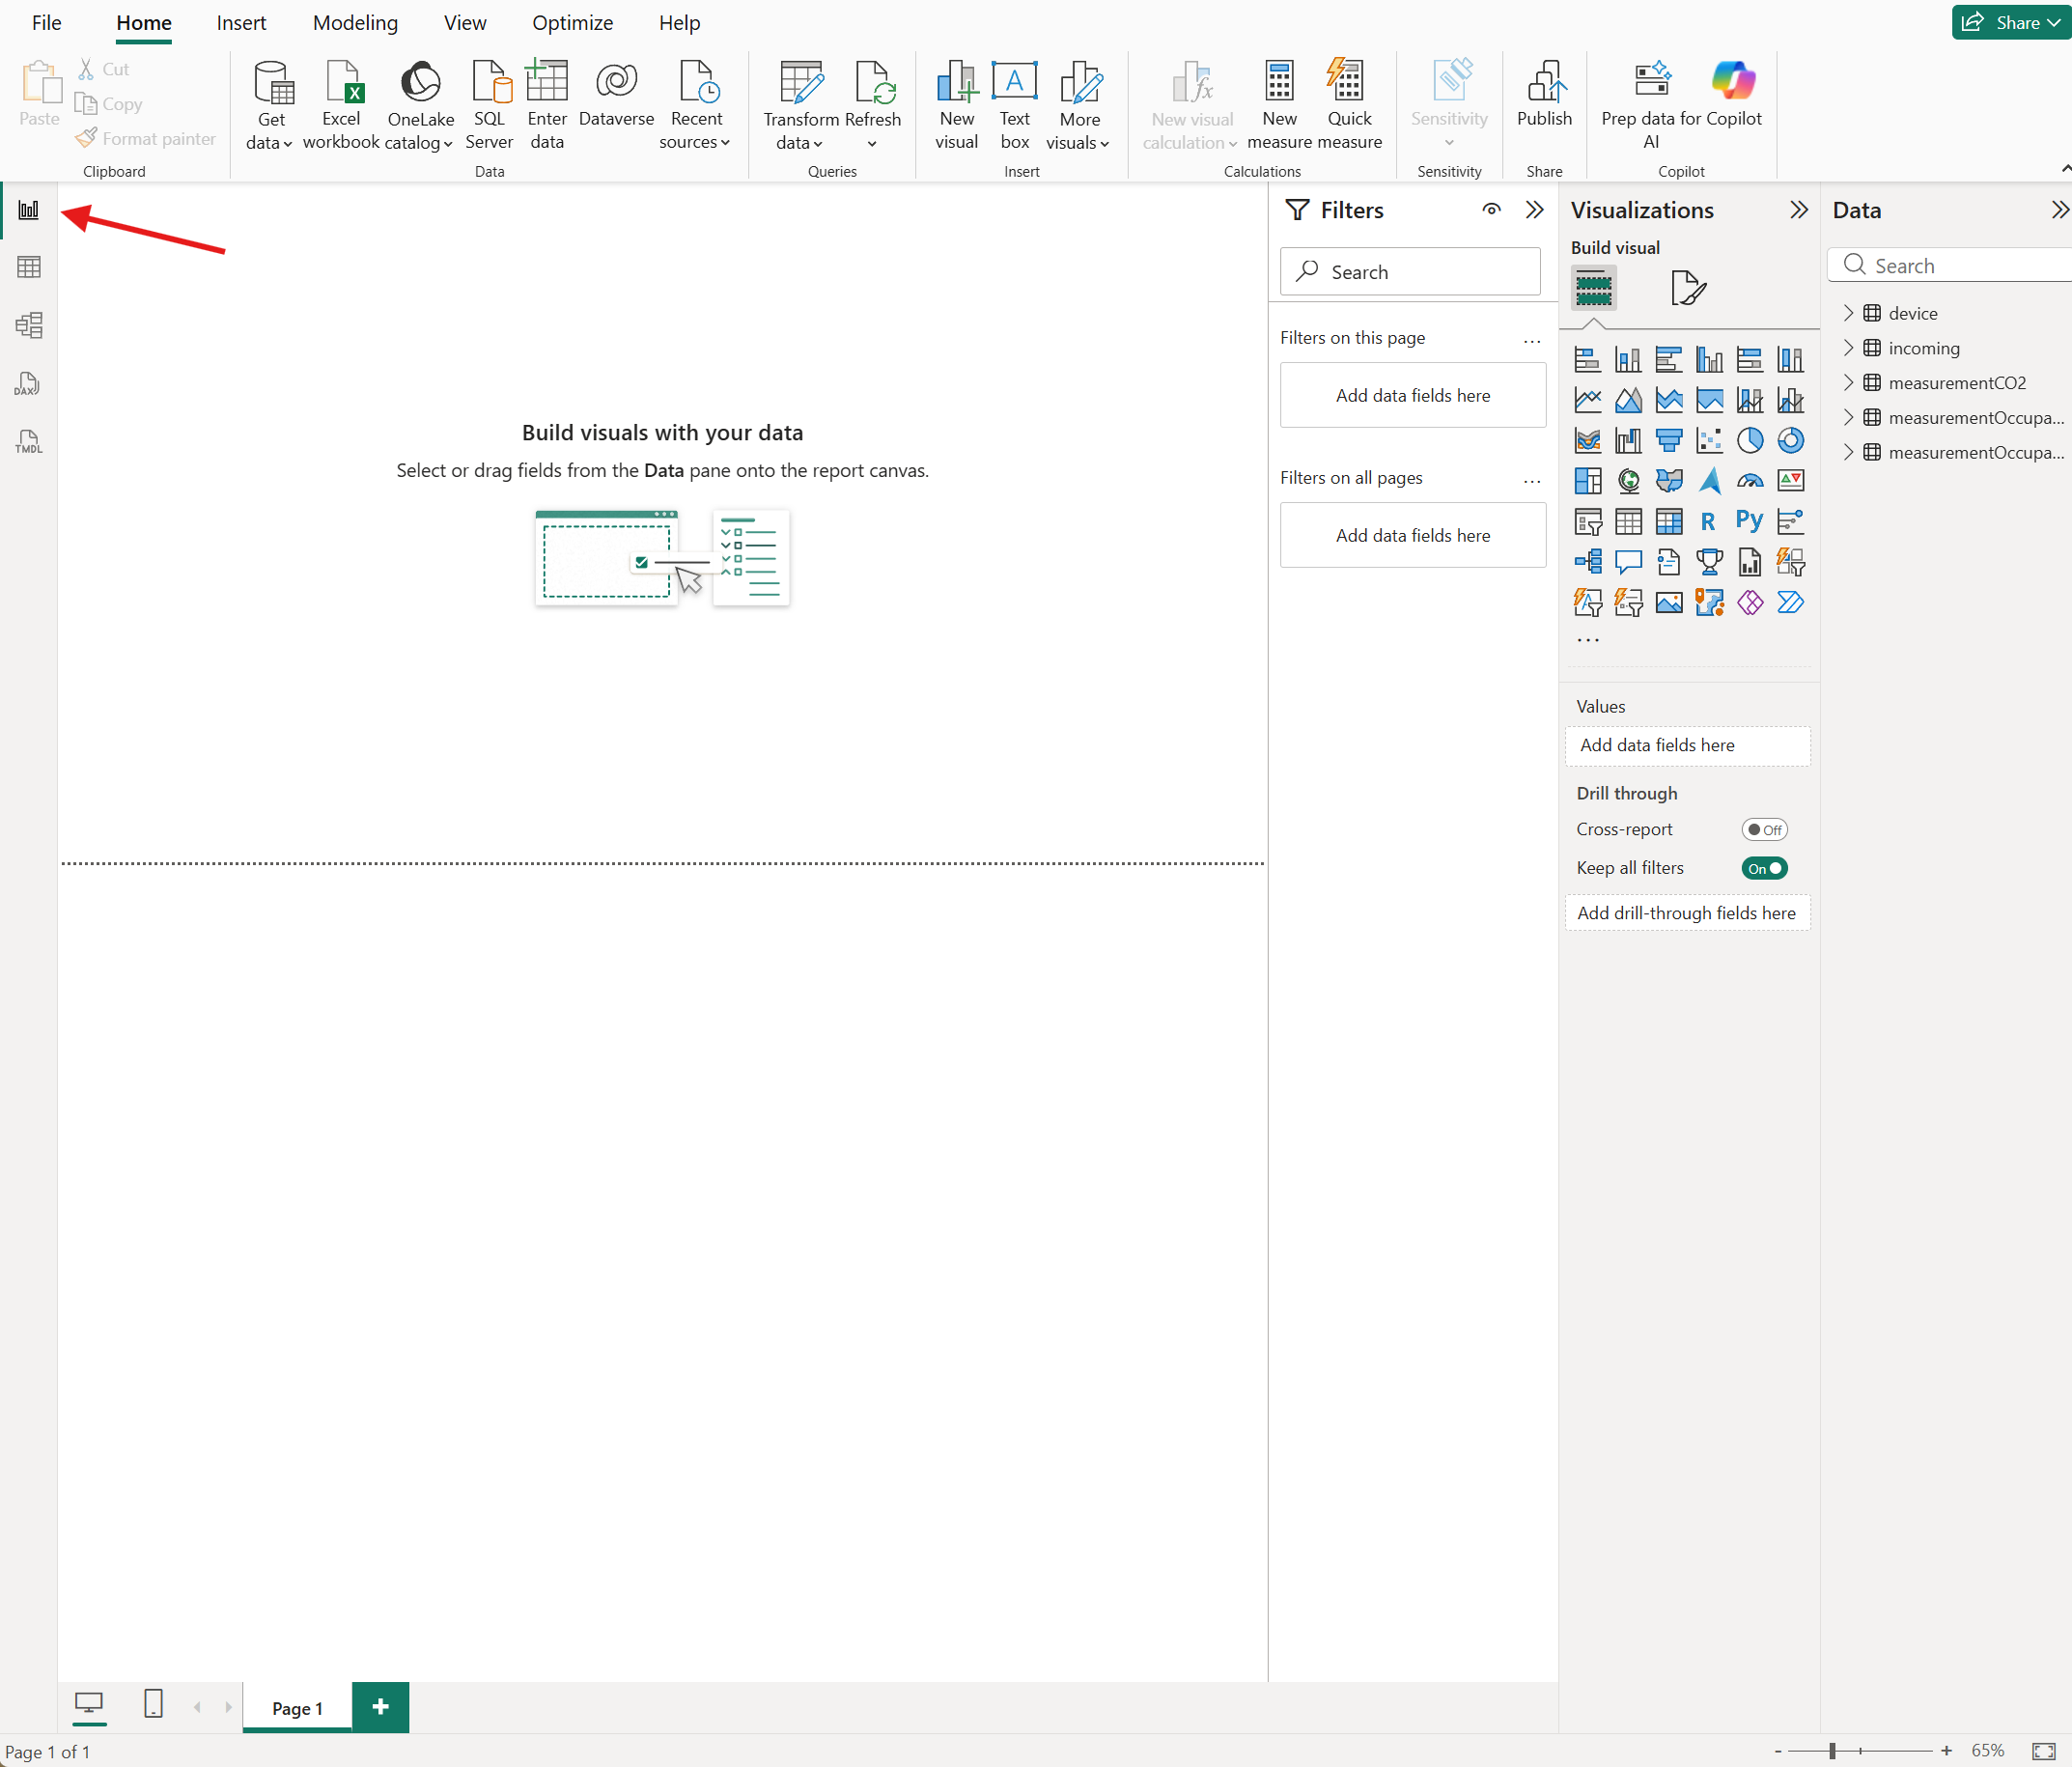
Open Power BI Desktop → New → Blank Report
Sign in to your Azure account (top-right corner)
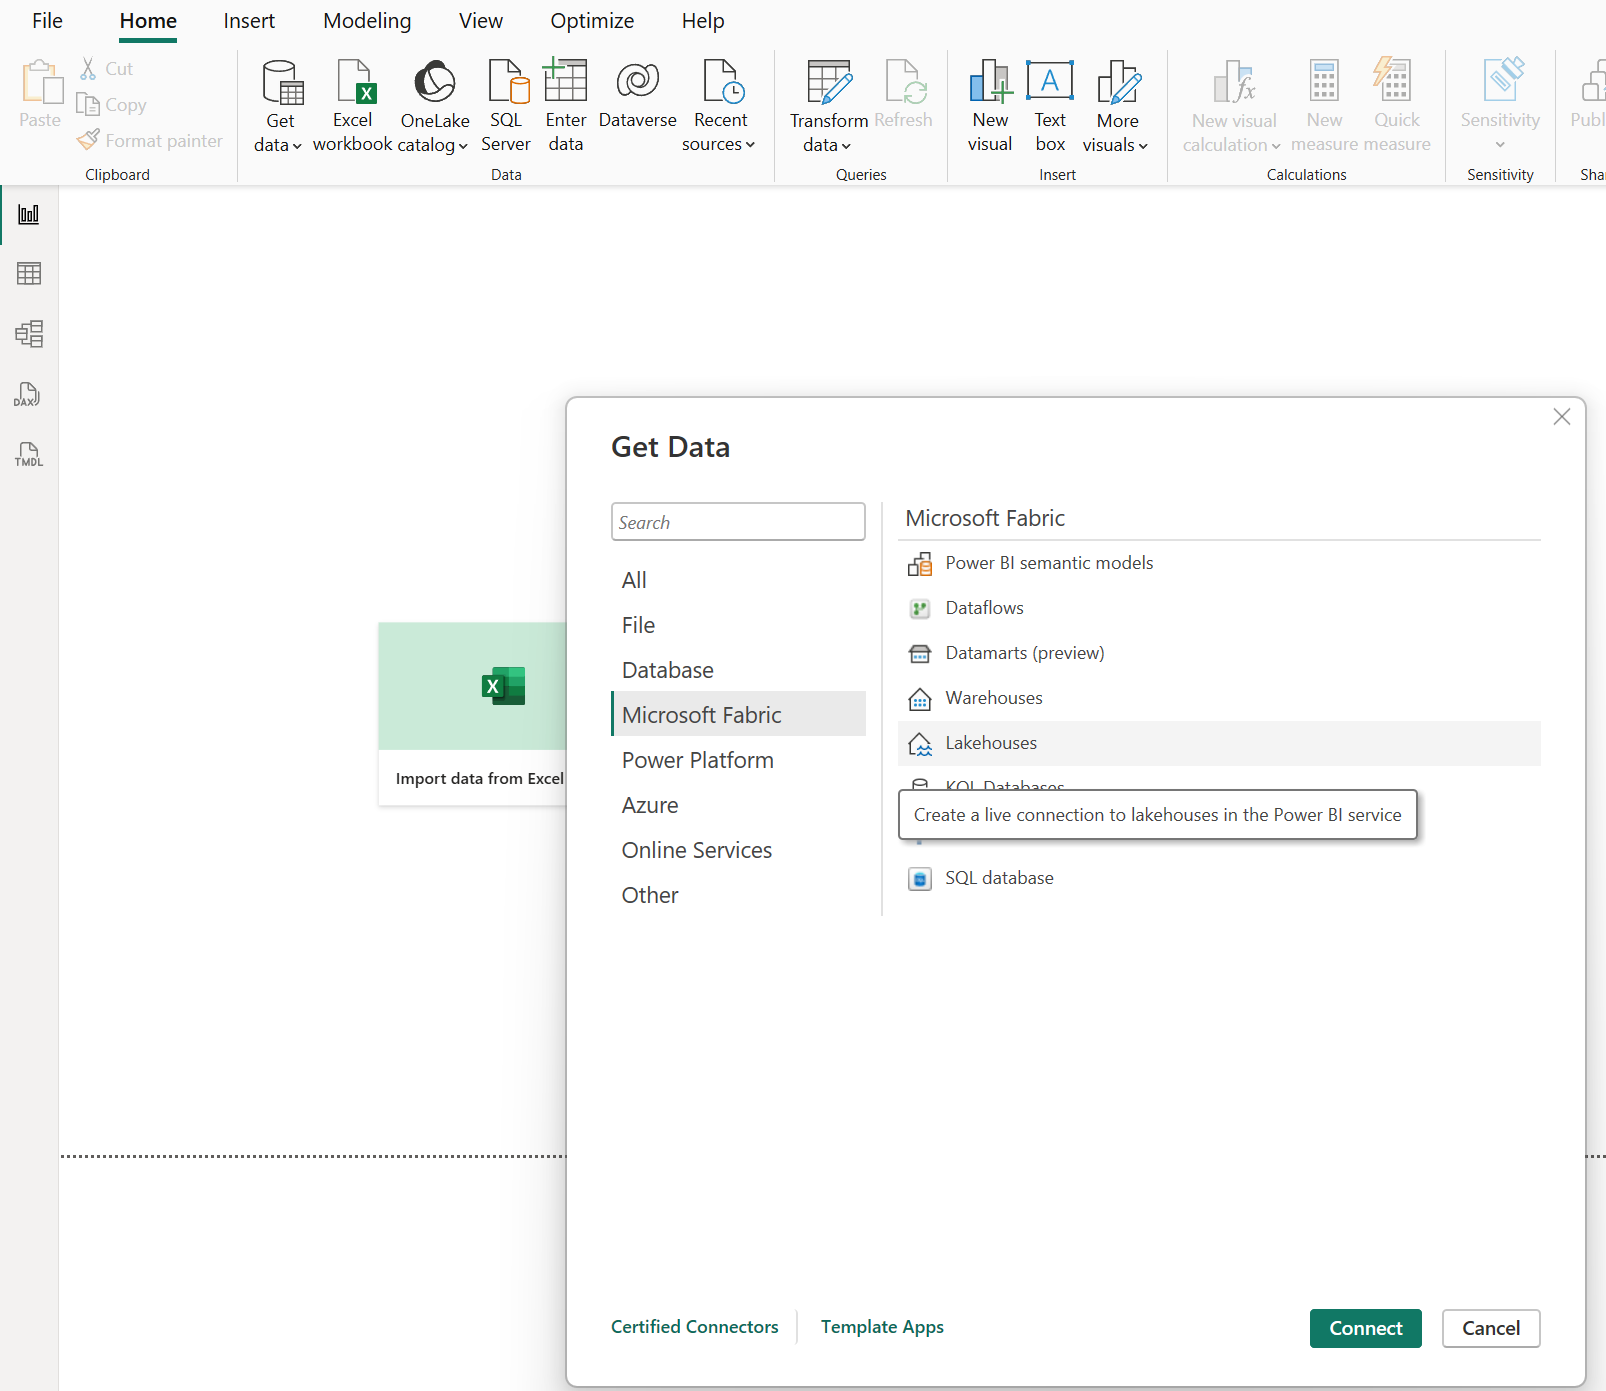
Select Get Data from another source → Microsoft Fabric → Lakehouses → Connect
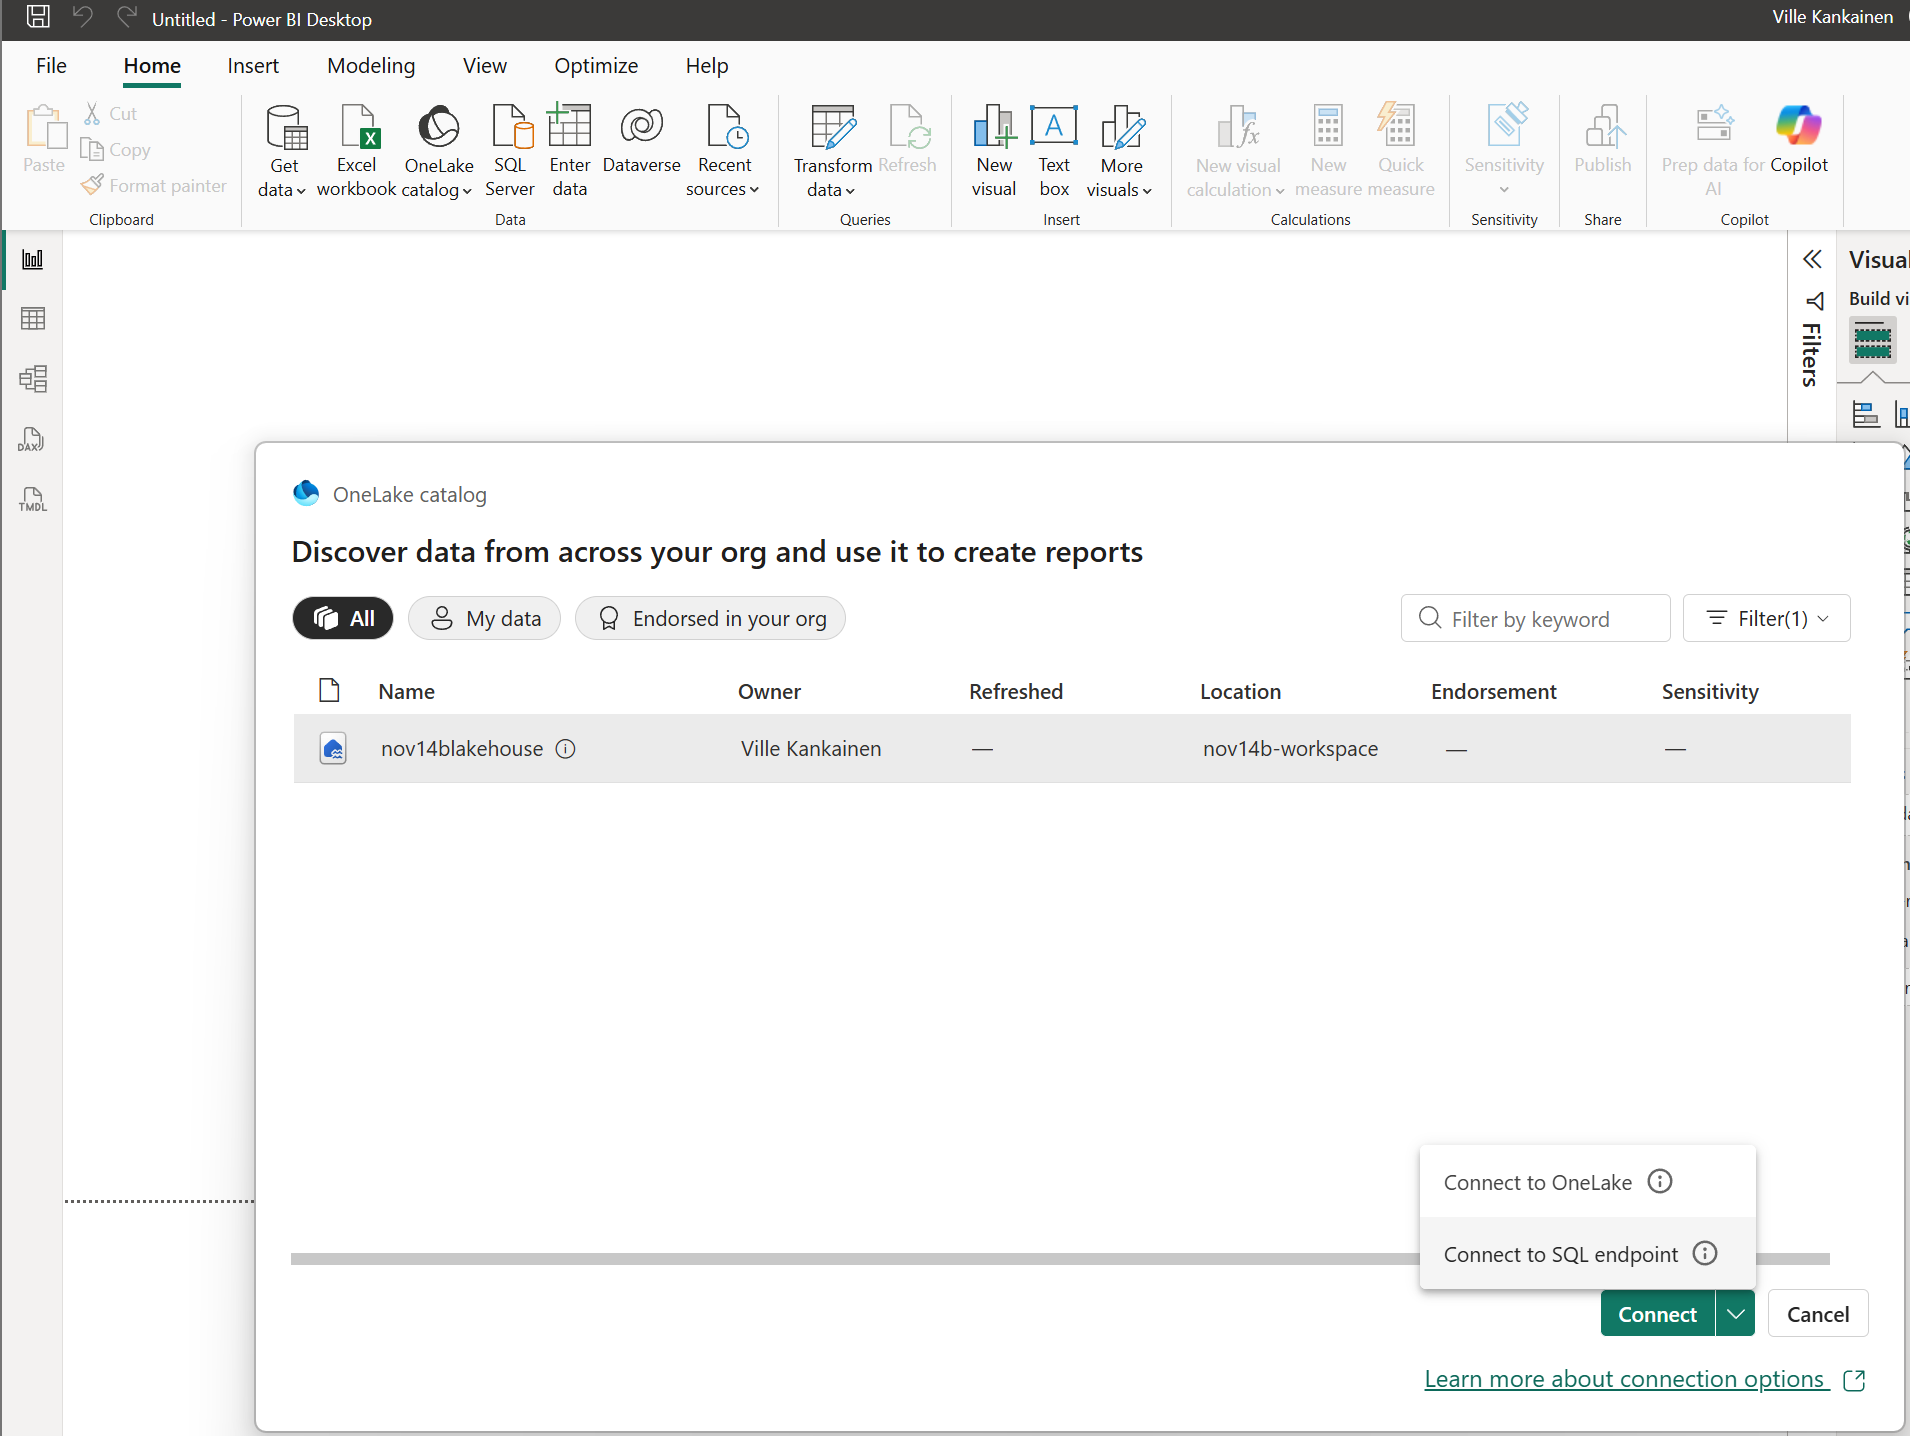
Select your Lakehouse and choose Connect to SQL endpoint from the Connect dropdown
Select the tables to import and click Load
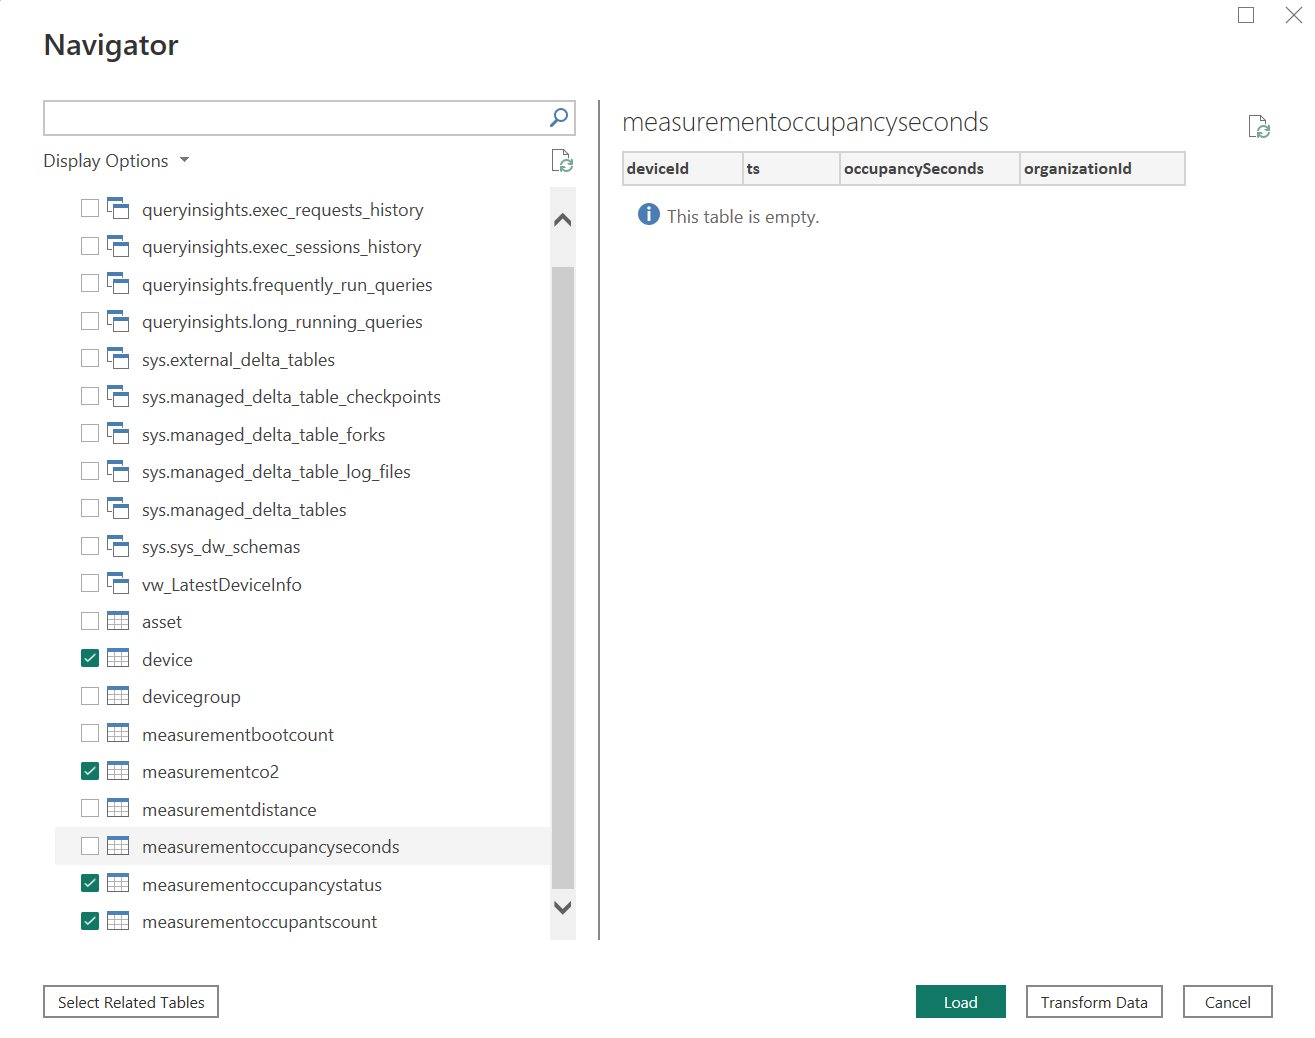
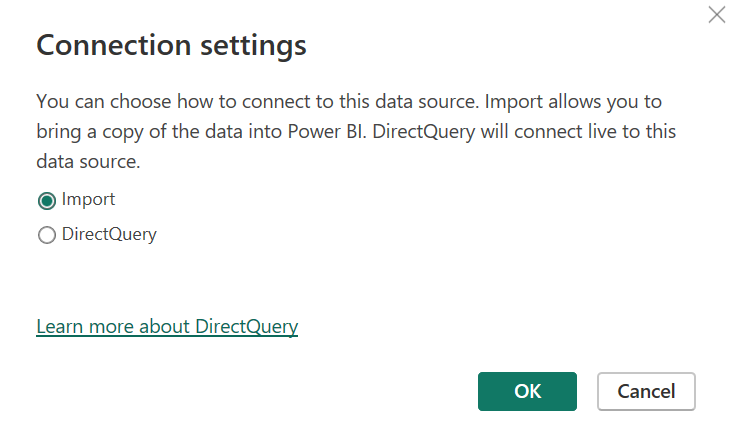
Choose Import to bring data into Power BI Desktop
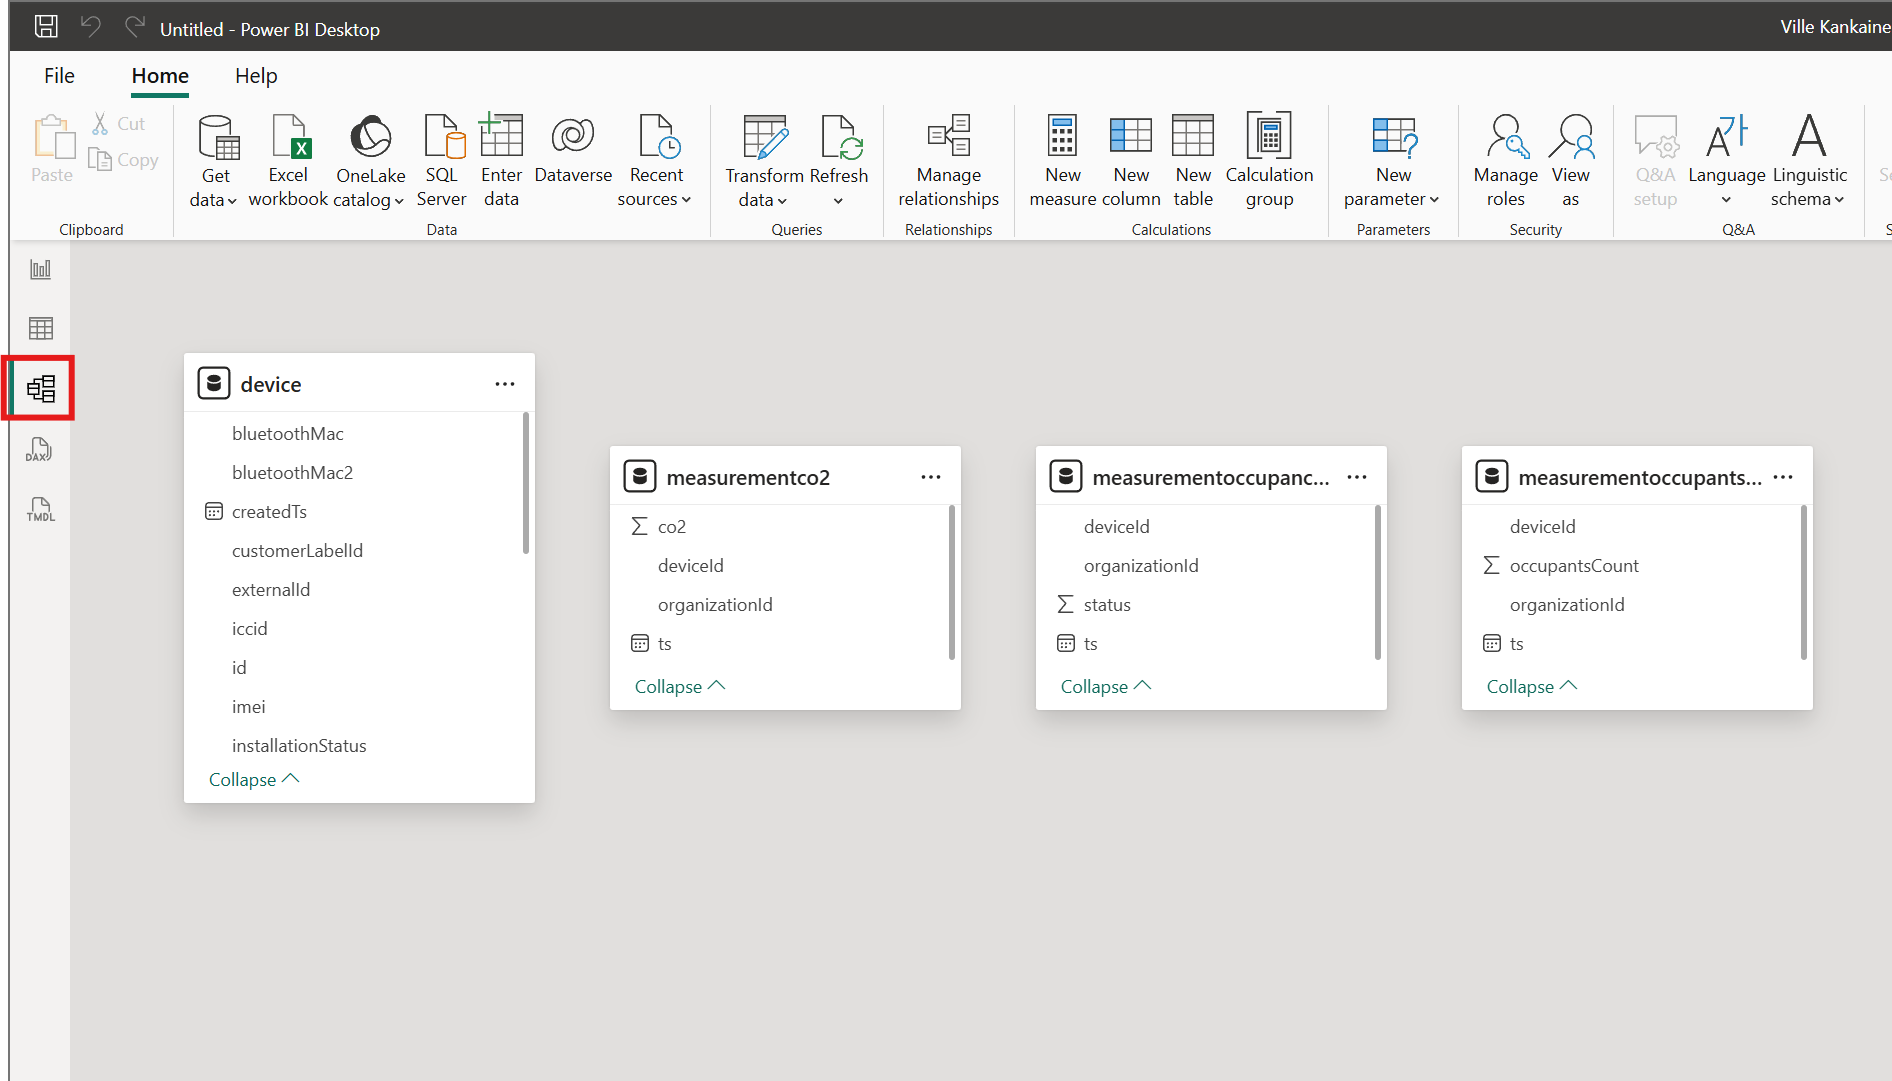
Tables are now visible in the Data pane
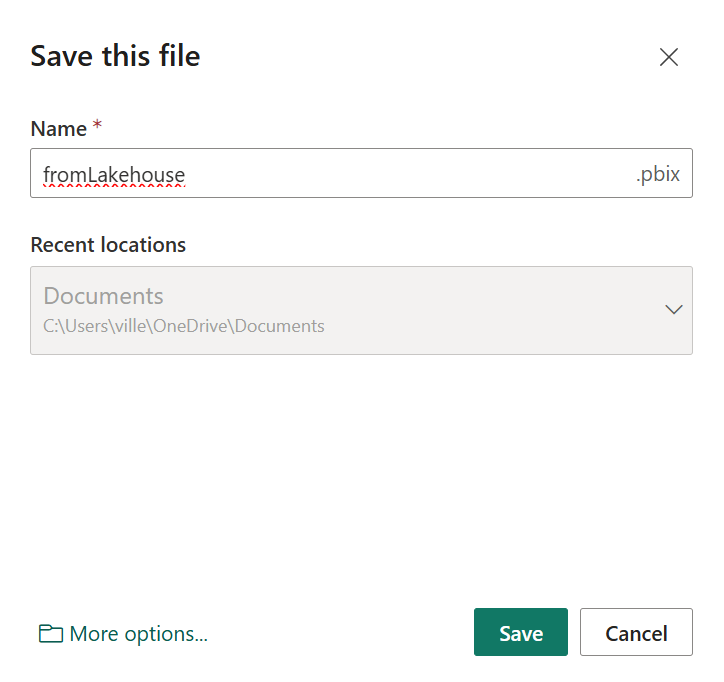
Save the report with Ctrl+S
Option B: Connect from Azure Blob Storage
Connect Power BI Desktop to Storage Account
Open Power BI Desktop → New → Blank Report
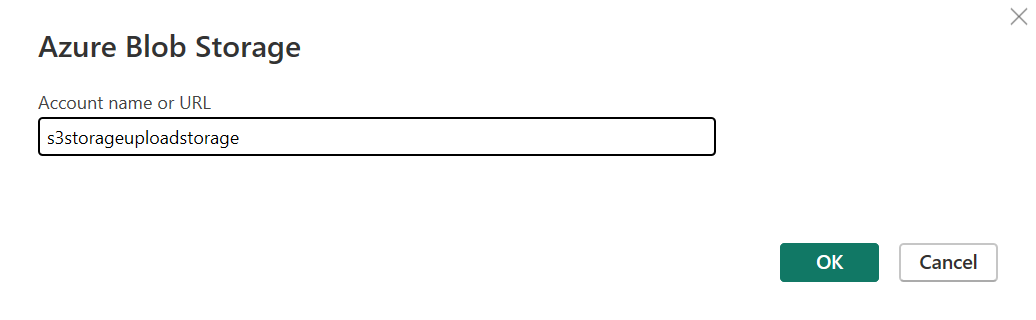
Select Get Data from another source → Azure Blob Storage → Connect
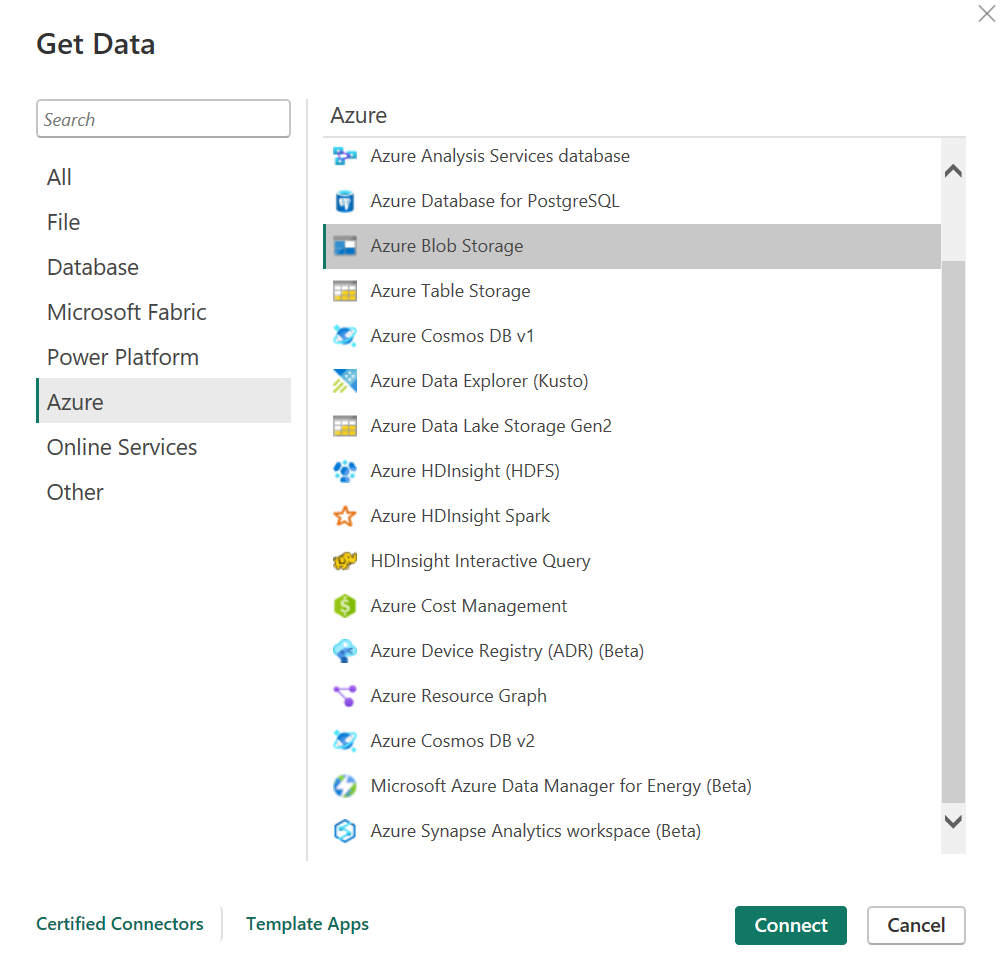
Enter the storage account name (make sure you’re signed in to Azure in Power BI Desktop)
Select the container and click Load
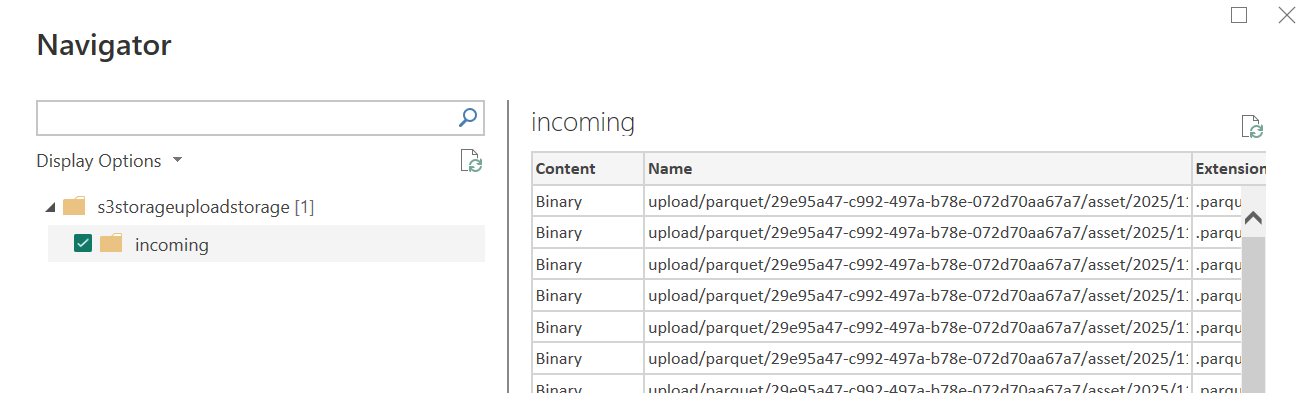
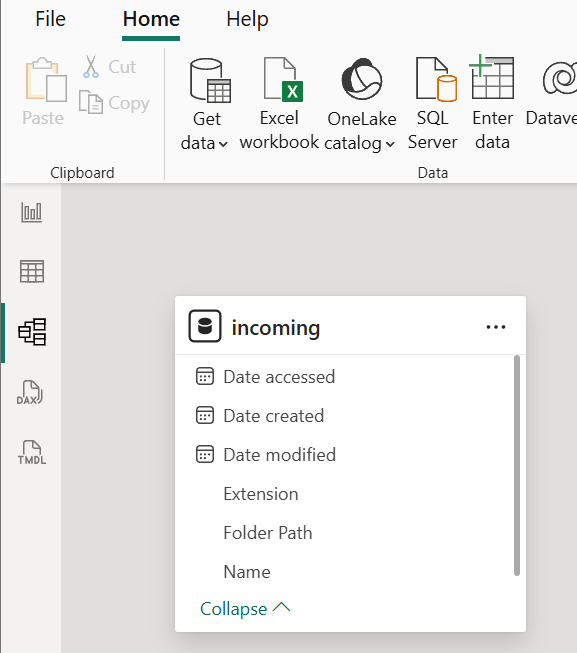
A raw table is loaded into the report
Create Data Tables with Power Query
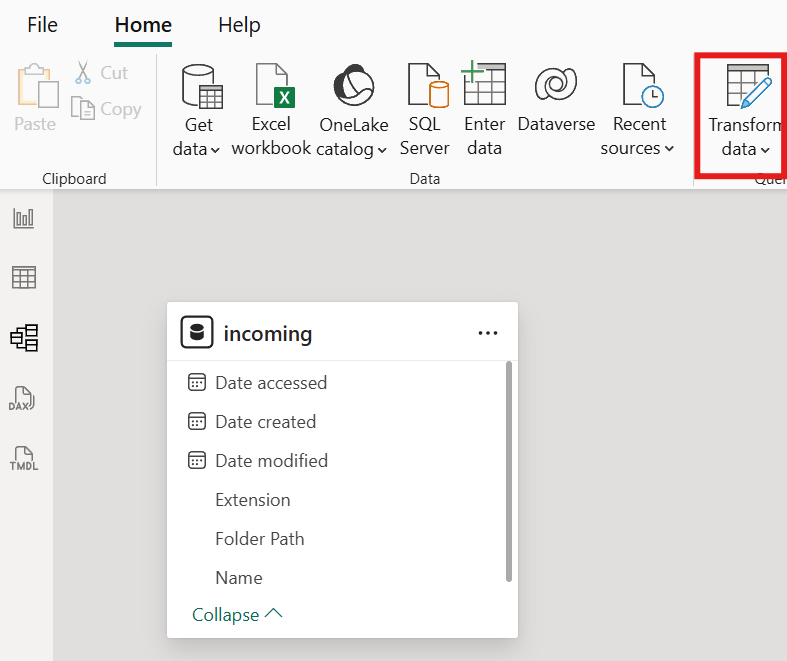
The raw blob data needs to be separated into logical tables. Select the table and click Transform Data to open Power Query Editor.
Device Table
In Power Query Editor, right-click in the Queries pane → New Query → Blank Query
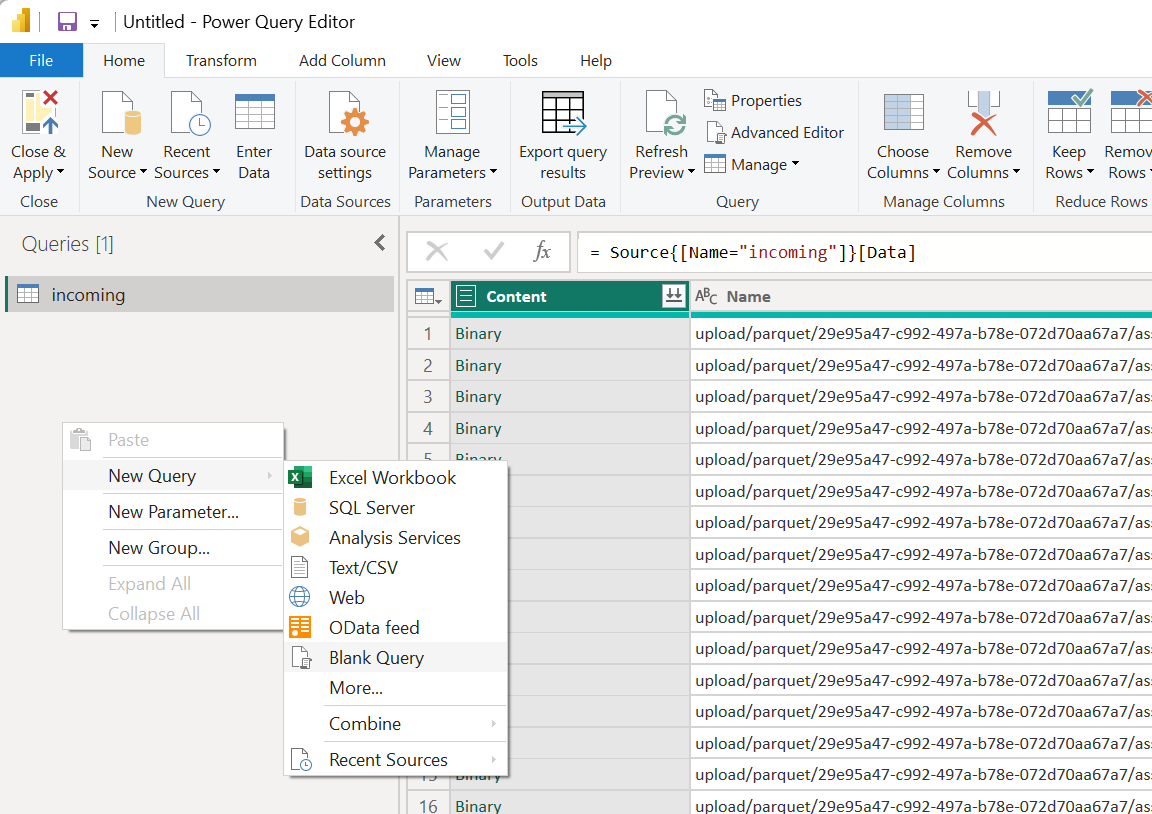
Rename the query to
device, right-click → Advanced Editor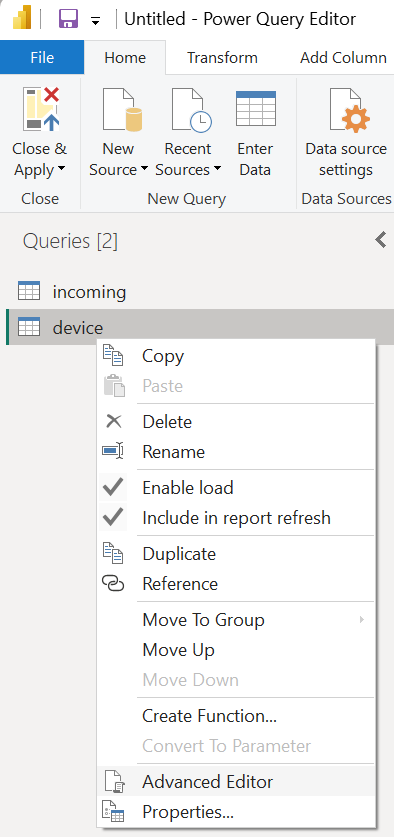
Paste the following Power Query M code:
let
    Source = AzureStorage.Blobs("YOUR_STORAGE_ACCOUNT_NAME"),
    IncomingContainer = Source{[Name = "incoming"]}[Data],
    FilteredParquet =
        Table.SelectRows(
            IncomingContainer,
            each [Extension] = ".parquet"
                 and Text.Contains([Name], "device")
        ),
    AddParquetTable =
        Table.AddColumn(
            FilteredParquet,
            "ParquetTable",
            each Parquet.Document([Content])
        ),
    KeepOnlyTableColumn =
        Table.SelectColumns(AddParquetTable, {"ParquetTable"}),
    Expanded =
        Table.ExpandTableColumn(
            KeepOnlyTableColumn,
            "ParquetTable",
            Table.ColumnNames(KeepOnlyTableColumn[ParquetTable]{0})
        ),
    Typed =
        Table.TransformColumnTypes(
            Expanded,
            {{"updatedTs", type datetime}}
        ),
    Grouped =
        Table.Group(
            Typed,
            {"id"},
            {{"Latest", each Table.Max(_, "updatedTs"), type record}}
        ),
    ColumnsToExpand = List.RemoveItems(Table.ColumnNames(Typed), {"id"}),
    Result =
        Table.ExpandRecordColumn(Grouped, "Latest", ColumnsToExpand)
in
    Result
Replace YOUR_STORAGE_ACCOUNT_NAME with your actual storage account name in all Power Query code below. The device table uses deduplication logic — for each id, only the row with the latest updatedTs is kept.
Measurement Tables
Create additional blank queries for each measurement type using the same pattern. Change the Text.Contains filter and column types for each table.
measurementOccupancyStatus:
let
    Source = AzureStorage.Blobs("YOUR_STORAGE_ACCOUNT_NAME"),
    IncomingContainer = Source{[Name = "incoming"]}[Data],
    FilteredParquet =
        Table.SelectRows(
            IncomingContainer,
            each [Extension] = ".parquet"
                 and Text.Contains([Name], "measurementOccupancyStatus")
        ),
    AddParquetTable =
        Table.AddColumn(
            FilteredParquet, "ParquetTable",
            each Parquet.Document([Content])
        ),
    KeepOnlyTableColumn =
        Table.SelectColumns(AddParquetTable, {"ParquetTable"}),
    Expanded =
        Table.ExpandTableColumn(
            KeepOnlyTableColumn, "ParquetTable",
            Table.ColumnNames(KeepOnlyTableColumn[ParquetTable]{0})
        ),
    ChangedType =
        Table.TransformColumnTypes(
            Expanded,
            {{"status", type number}, {"ts", type datetime}},
            "en-US"
        )
in
    ChangedType
measurementOccupantsCount:
let
    Source = AzureStorage.Blobs("YOUR_STORAGE_ACCOUNT_NAME"),
    IncomingContainer = Source{[Name = "incoming"]}[Data],
    FilteredParquet =
        Table.SelectRows(
            IncomingContainer,
            each [Extension] = ".parquet"
                 and Text.Contains([Name], "measurementOccupantsCount")
        ),
    AddParquetTable =
        Table.AddColumn(
            FilteredParquet, "ParquetTable",
            each Parquet.Document([Content])
        ),
    KeepOnlyTableColumn =
        Table.SelectColumns(AddParquetTable, {"ParquetTable"}),
    Expanded =
        Table.ExpandTableColumn(
            KeepOnlyTableColumn, "ParquetTable",
            Table.ColumnNames(KeepOnlyTableColumn[ParquetTable]{0})
        ),
    ChangedType =
        Table.TransformColumnTypes(
            Expanded,
            {{"occupantsCount", type number}, {"ts", type datetime}},
            "en-US"
        )
in
    ChangedType
measurementCO2:
let
    Source = AzureStorage.Blobs("YOUR_STORAGE_ACCOUNT_NAME"),
    IncomingContainer = Source{[Name = "incoming"]}[Data],
    FilteredParquet =
        Table.SelectRows(
            IncomingContainer,
            each [Extension] = ".parquet"
                 and Text.Contains([Name], "measurementCO2")
        ),
    AddParquetTable =
        Table.AddColumn(
            FilteredParquet, "ParquetTable",
            each Parquet.Document([Content])
        ),
    KeepOnlyTableColumn =
        Table.SelectColumns(AddParquetTable, {"ParquetTable"}),
    Expanded =
        Table.ExpandTableColumn(
            KeepOnlyTableColumn, "ParquetTable",
            Table.ColumnNames(KeepOnlyTableColumn[ParquetTable]{0})
        ),
    ChangedType =
        Table.TransformColumnTypes(
            Expanded,
            {{"co2", type number}, {"ts", type datetime}},
            "en-US"
        )
in
    ChangedType
After creating all queries, click Close & Apply to save.
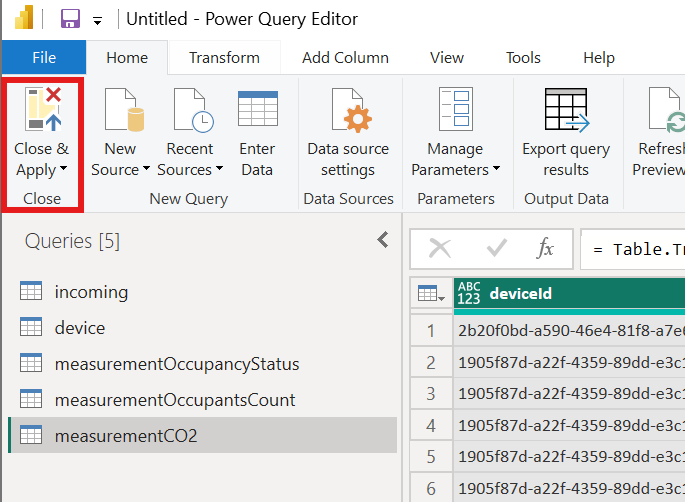
Save the report with Ctrl+S.
Create Data Relationships
Regardless of which data source you used, set up relationships between the device table and measurement tables.
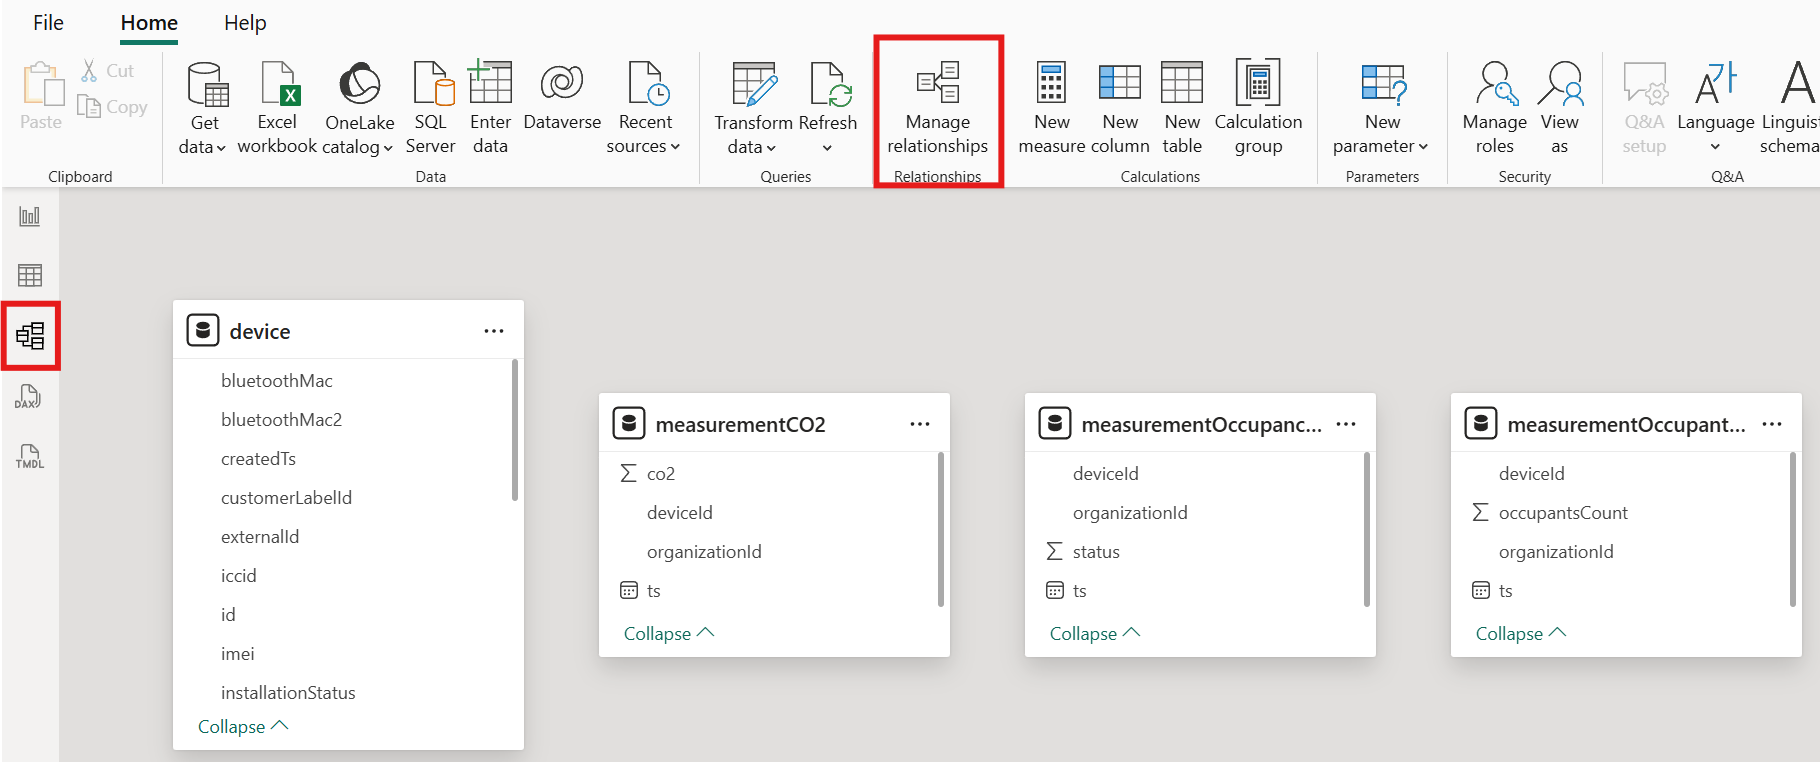
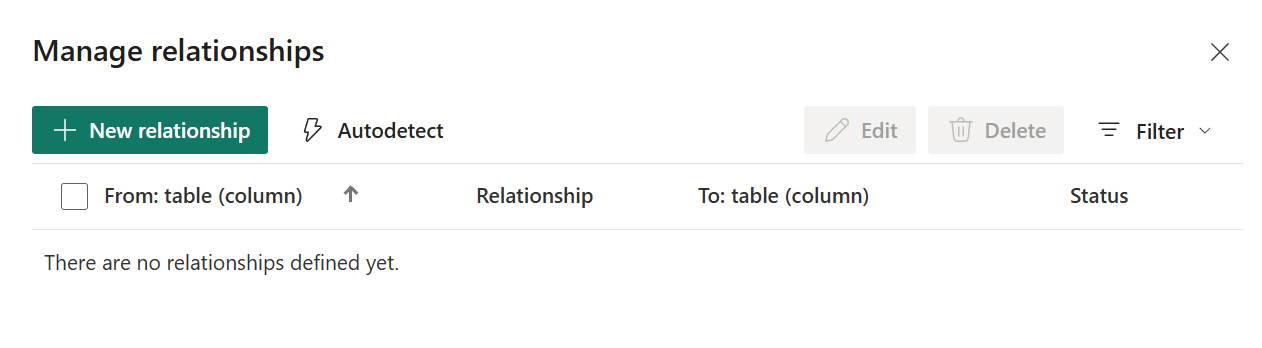
Switch to Model view and open Manage relationships
Click New to create a relationship
Select
deviceas the primary table andmeasurementCO2as the related table. Mapid(device) →deviceId(measurement)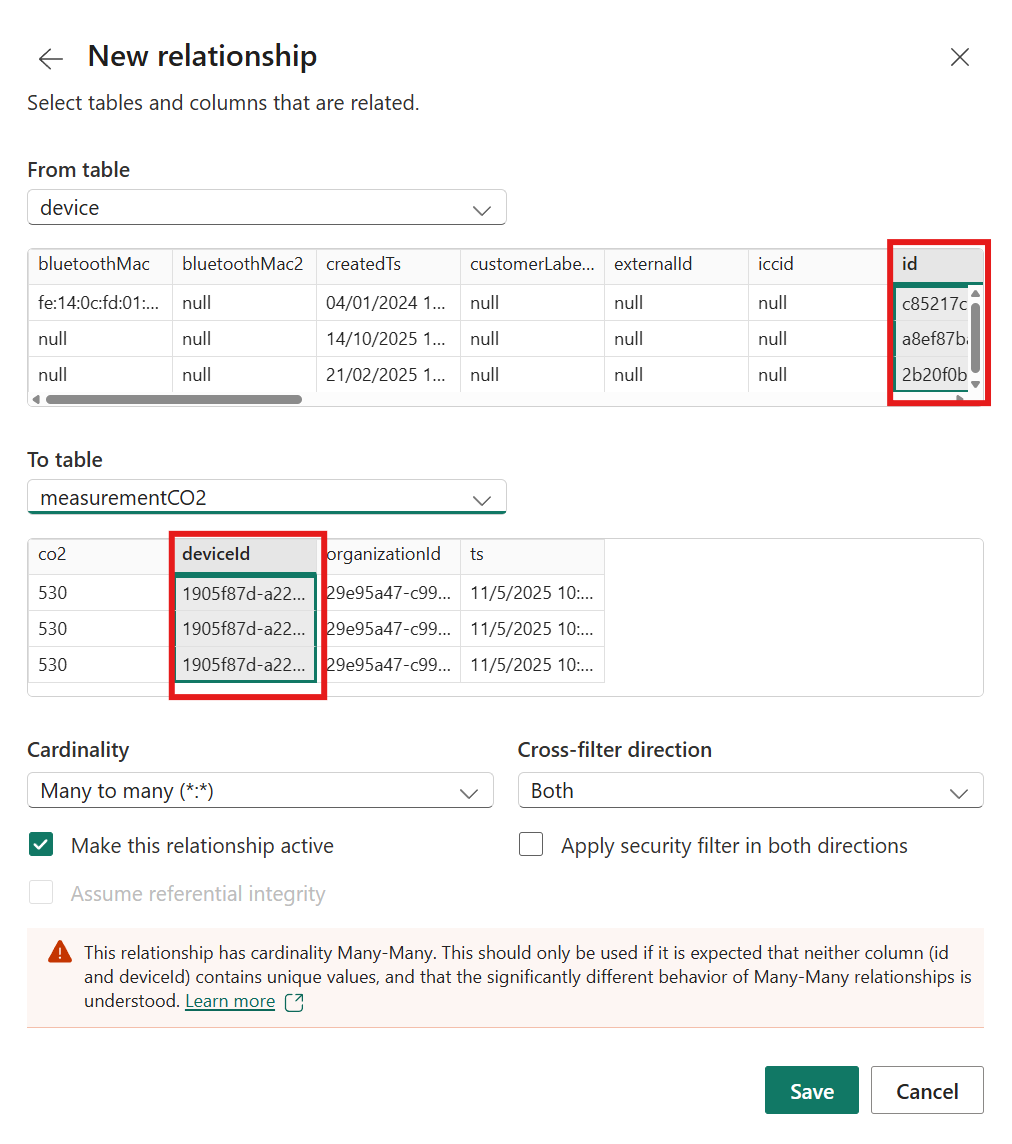
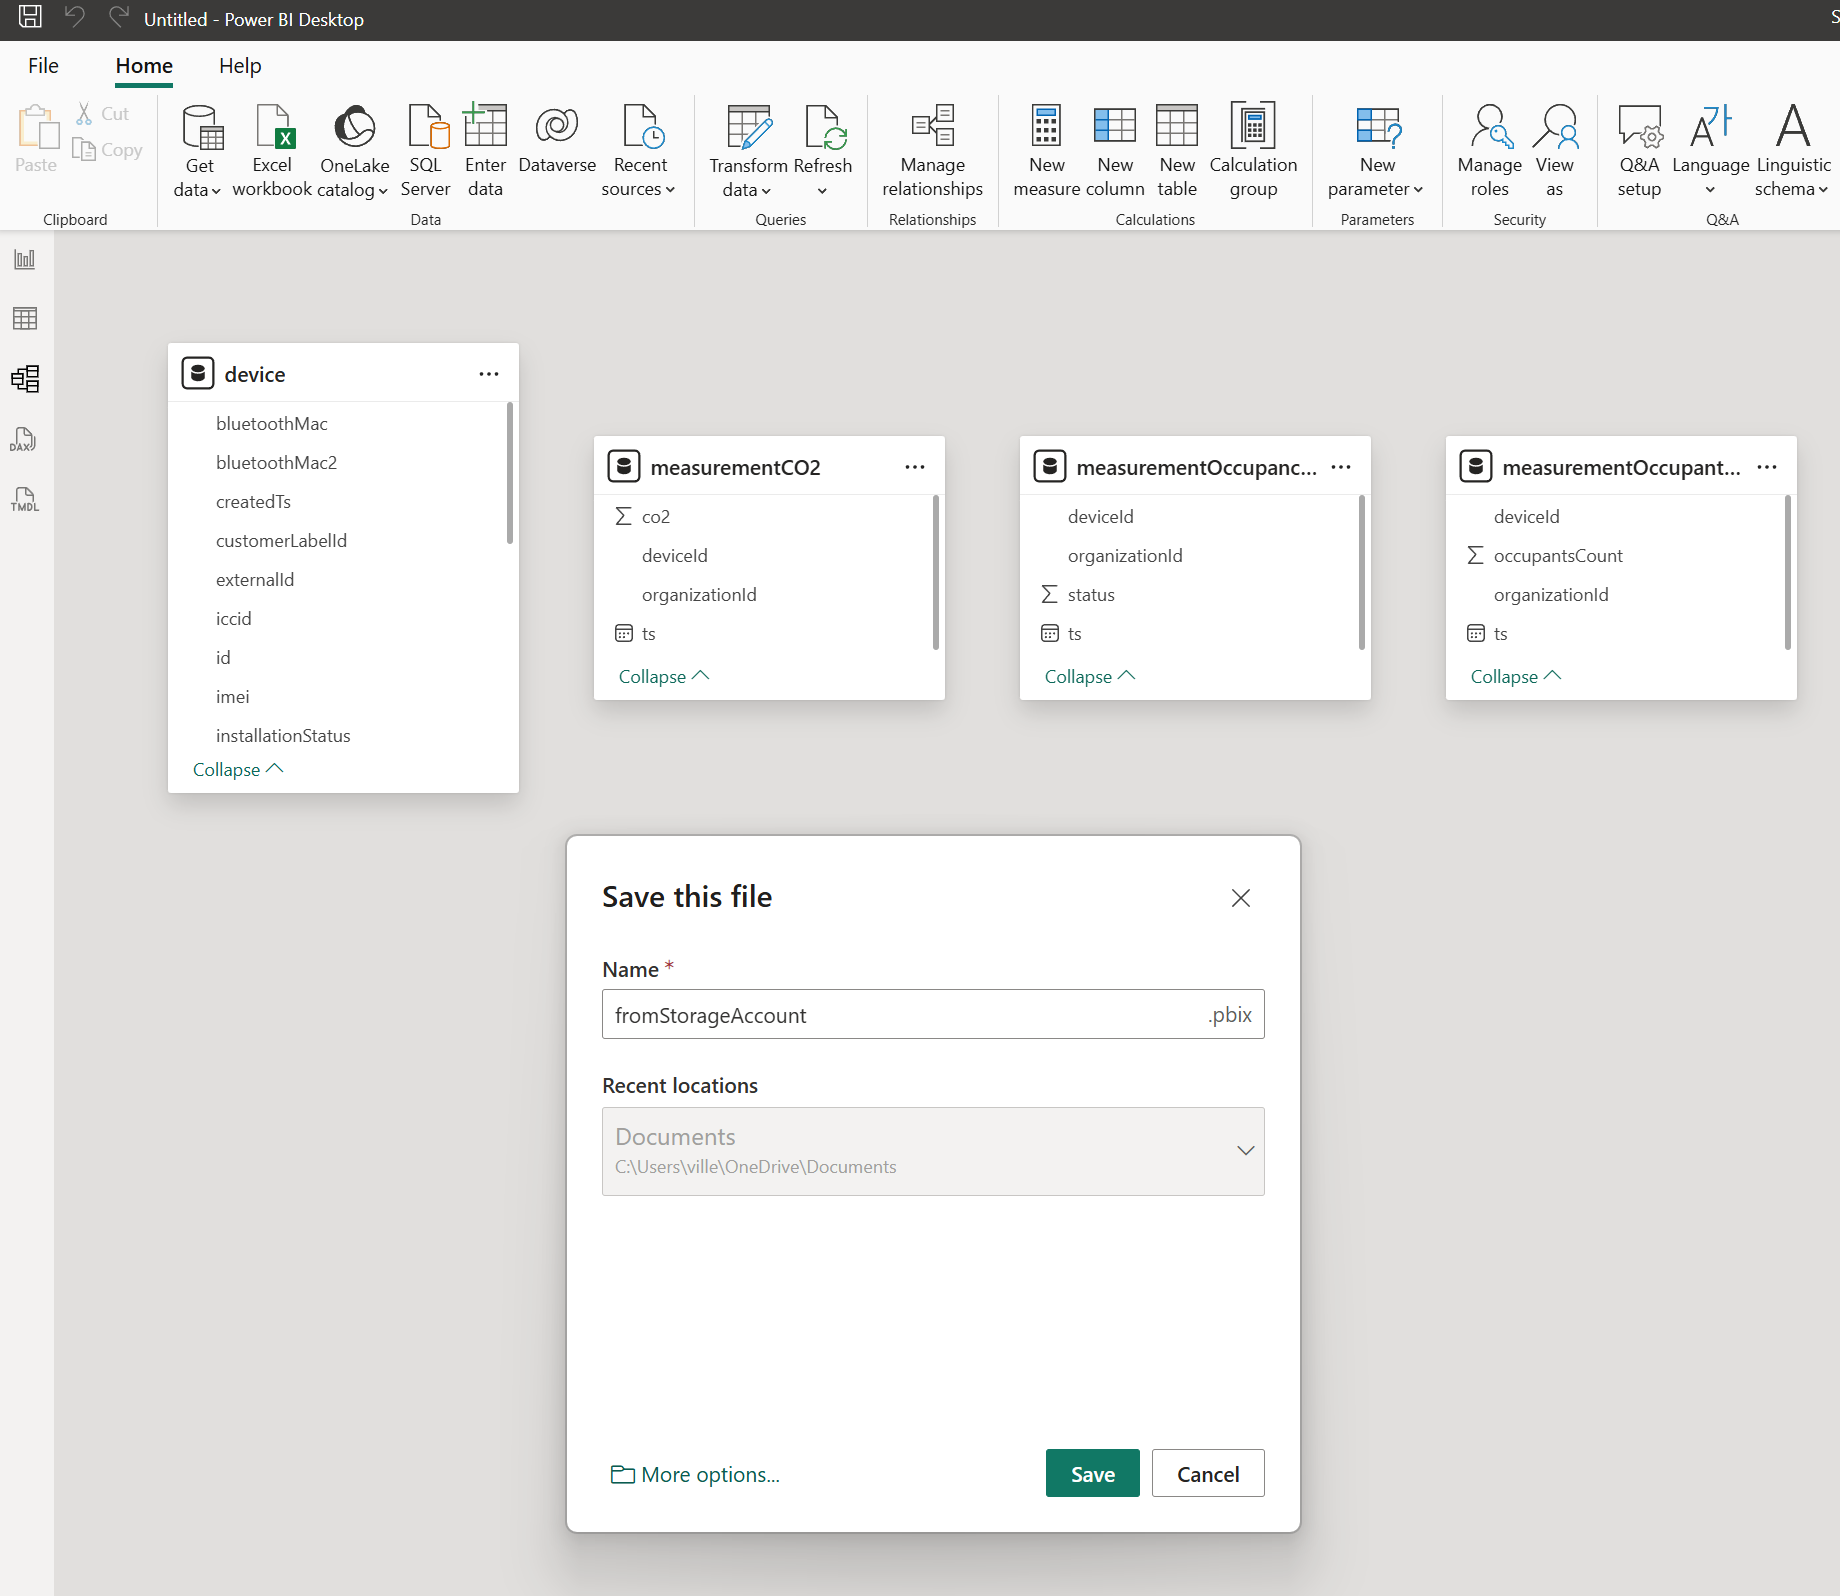
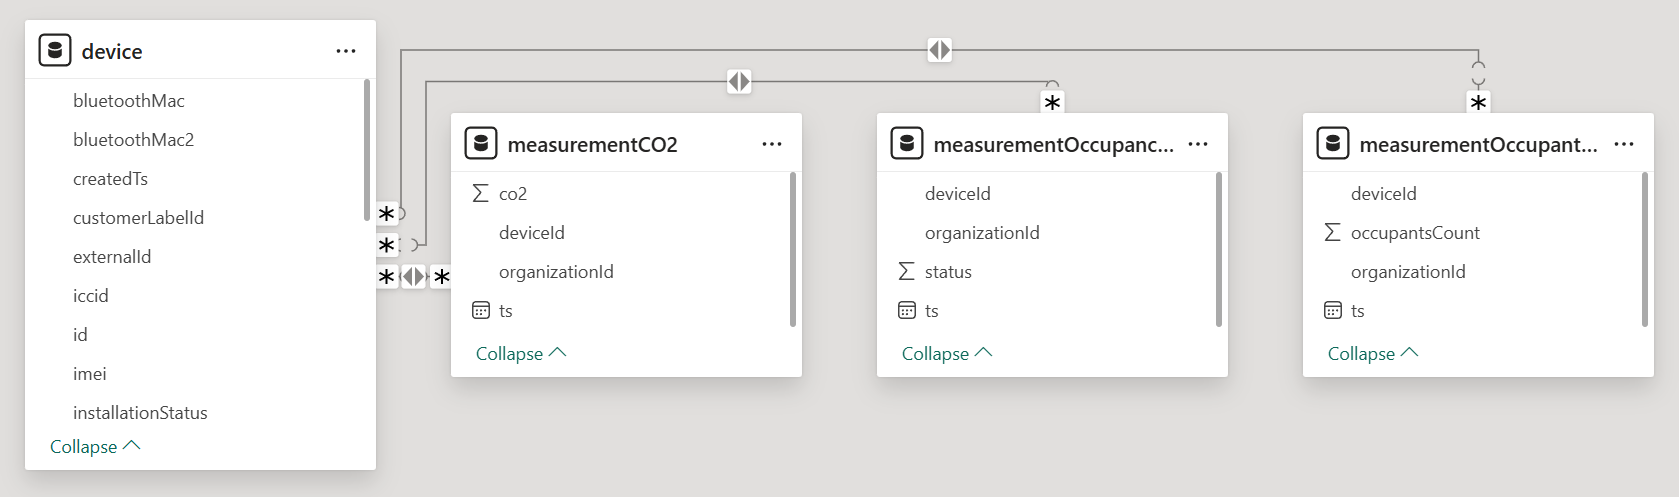
Repeat for
measurementOccupantsCountandmeasurementOccupancyStatusThe final model should look like this:
Create Visualizations
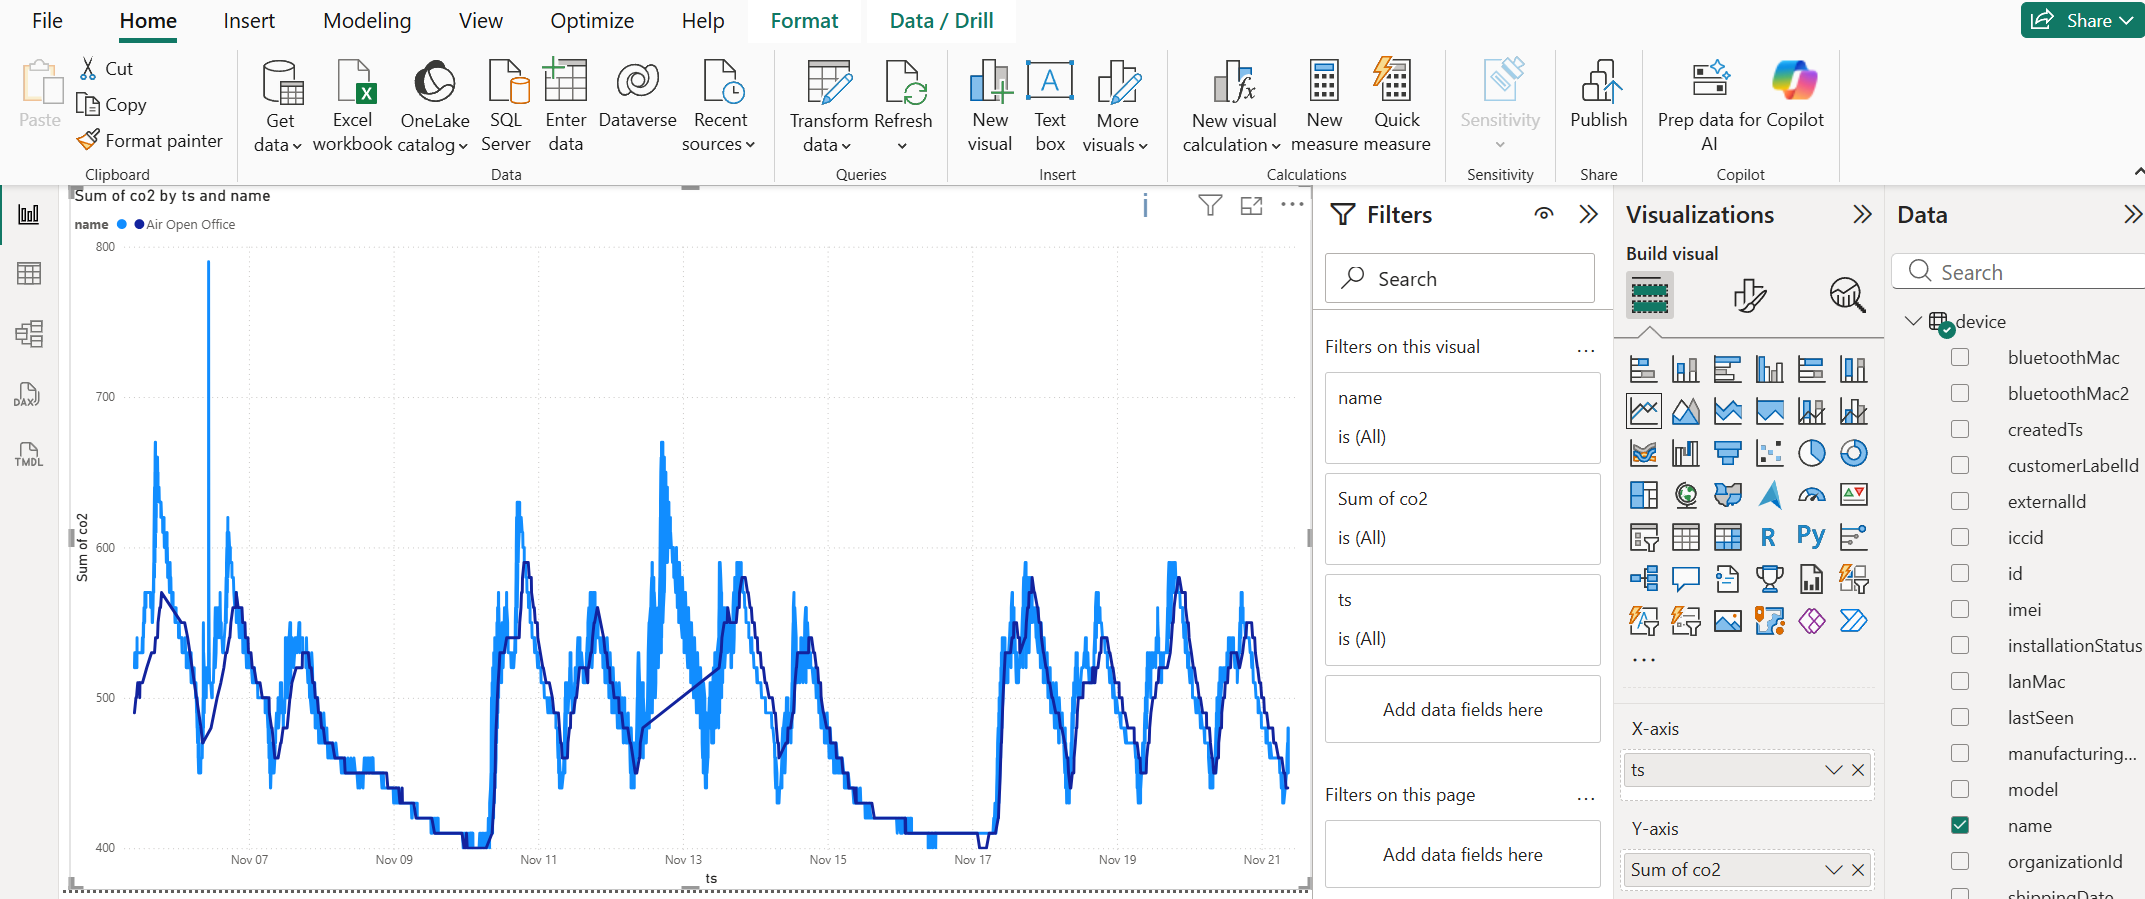
CO2 Line Chart
Switch to Report view
Select Line Chart and resize the placeholder
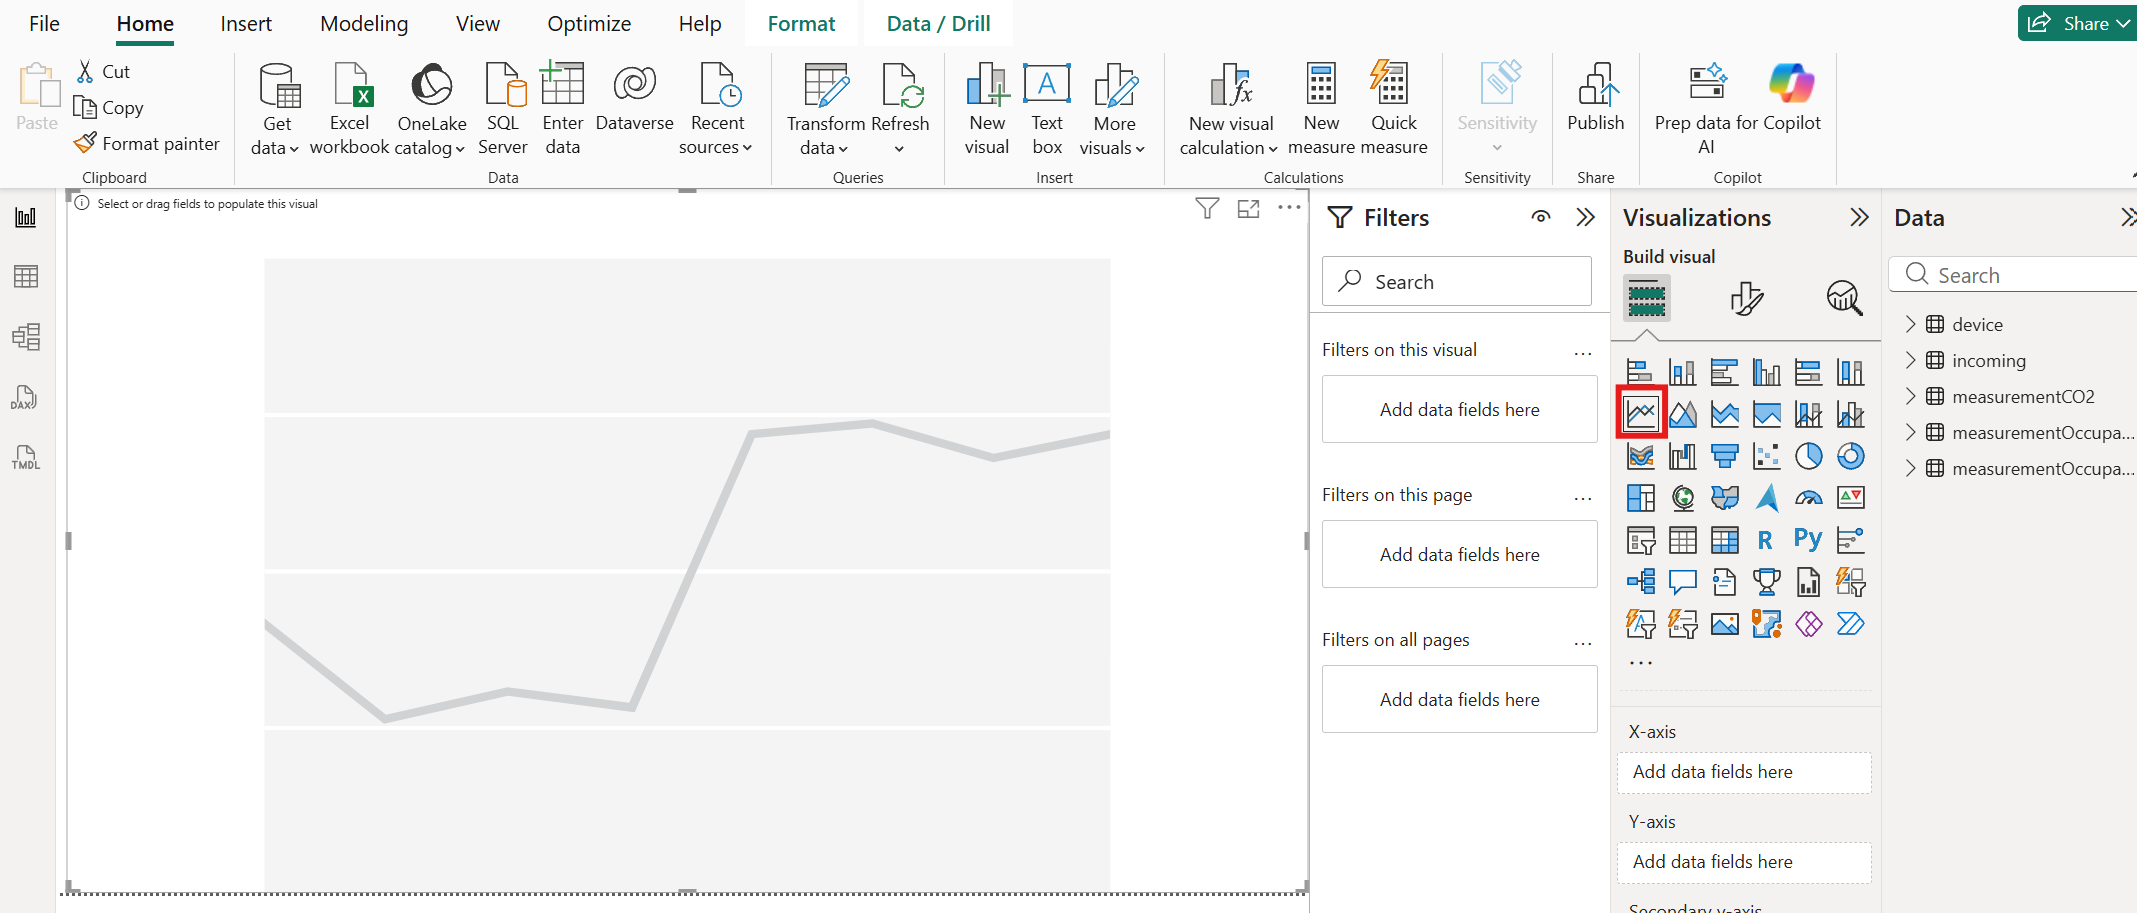
From the Data pane, drag
co2frommeasurementCO2,ts, andnamefromdeviceto the visual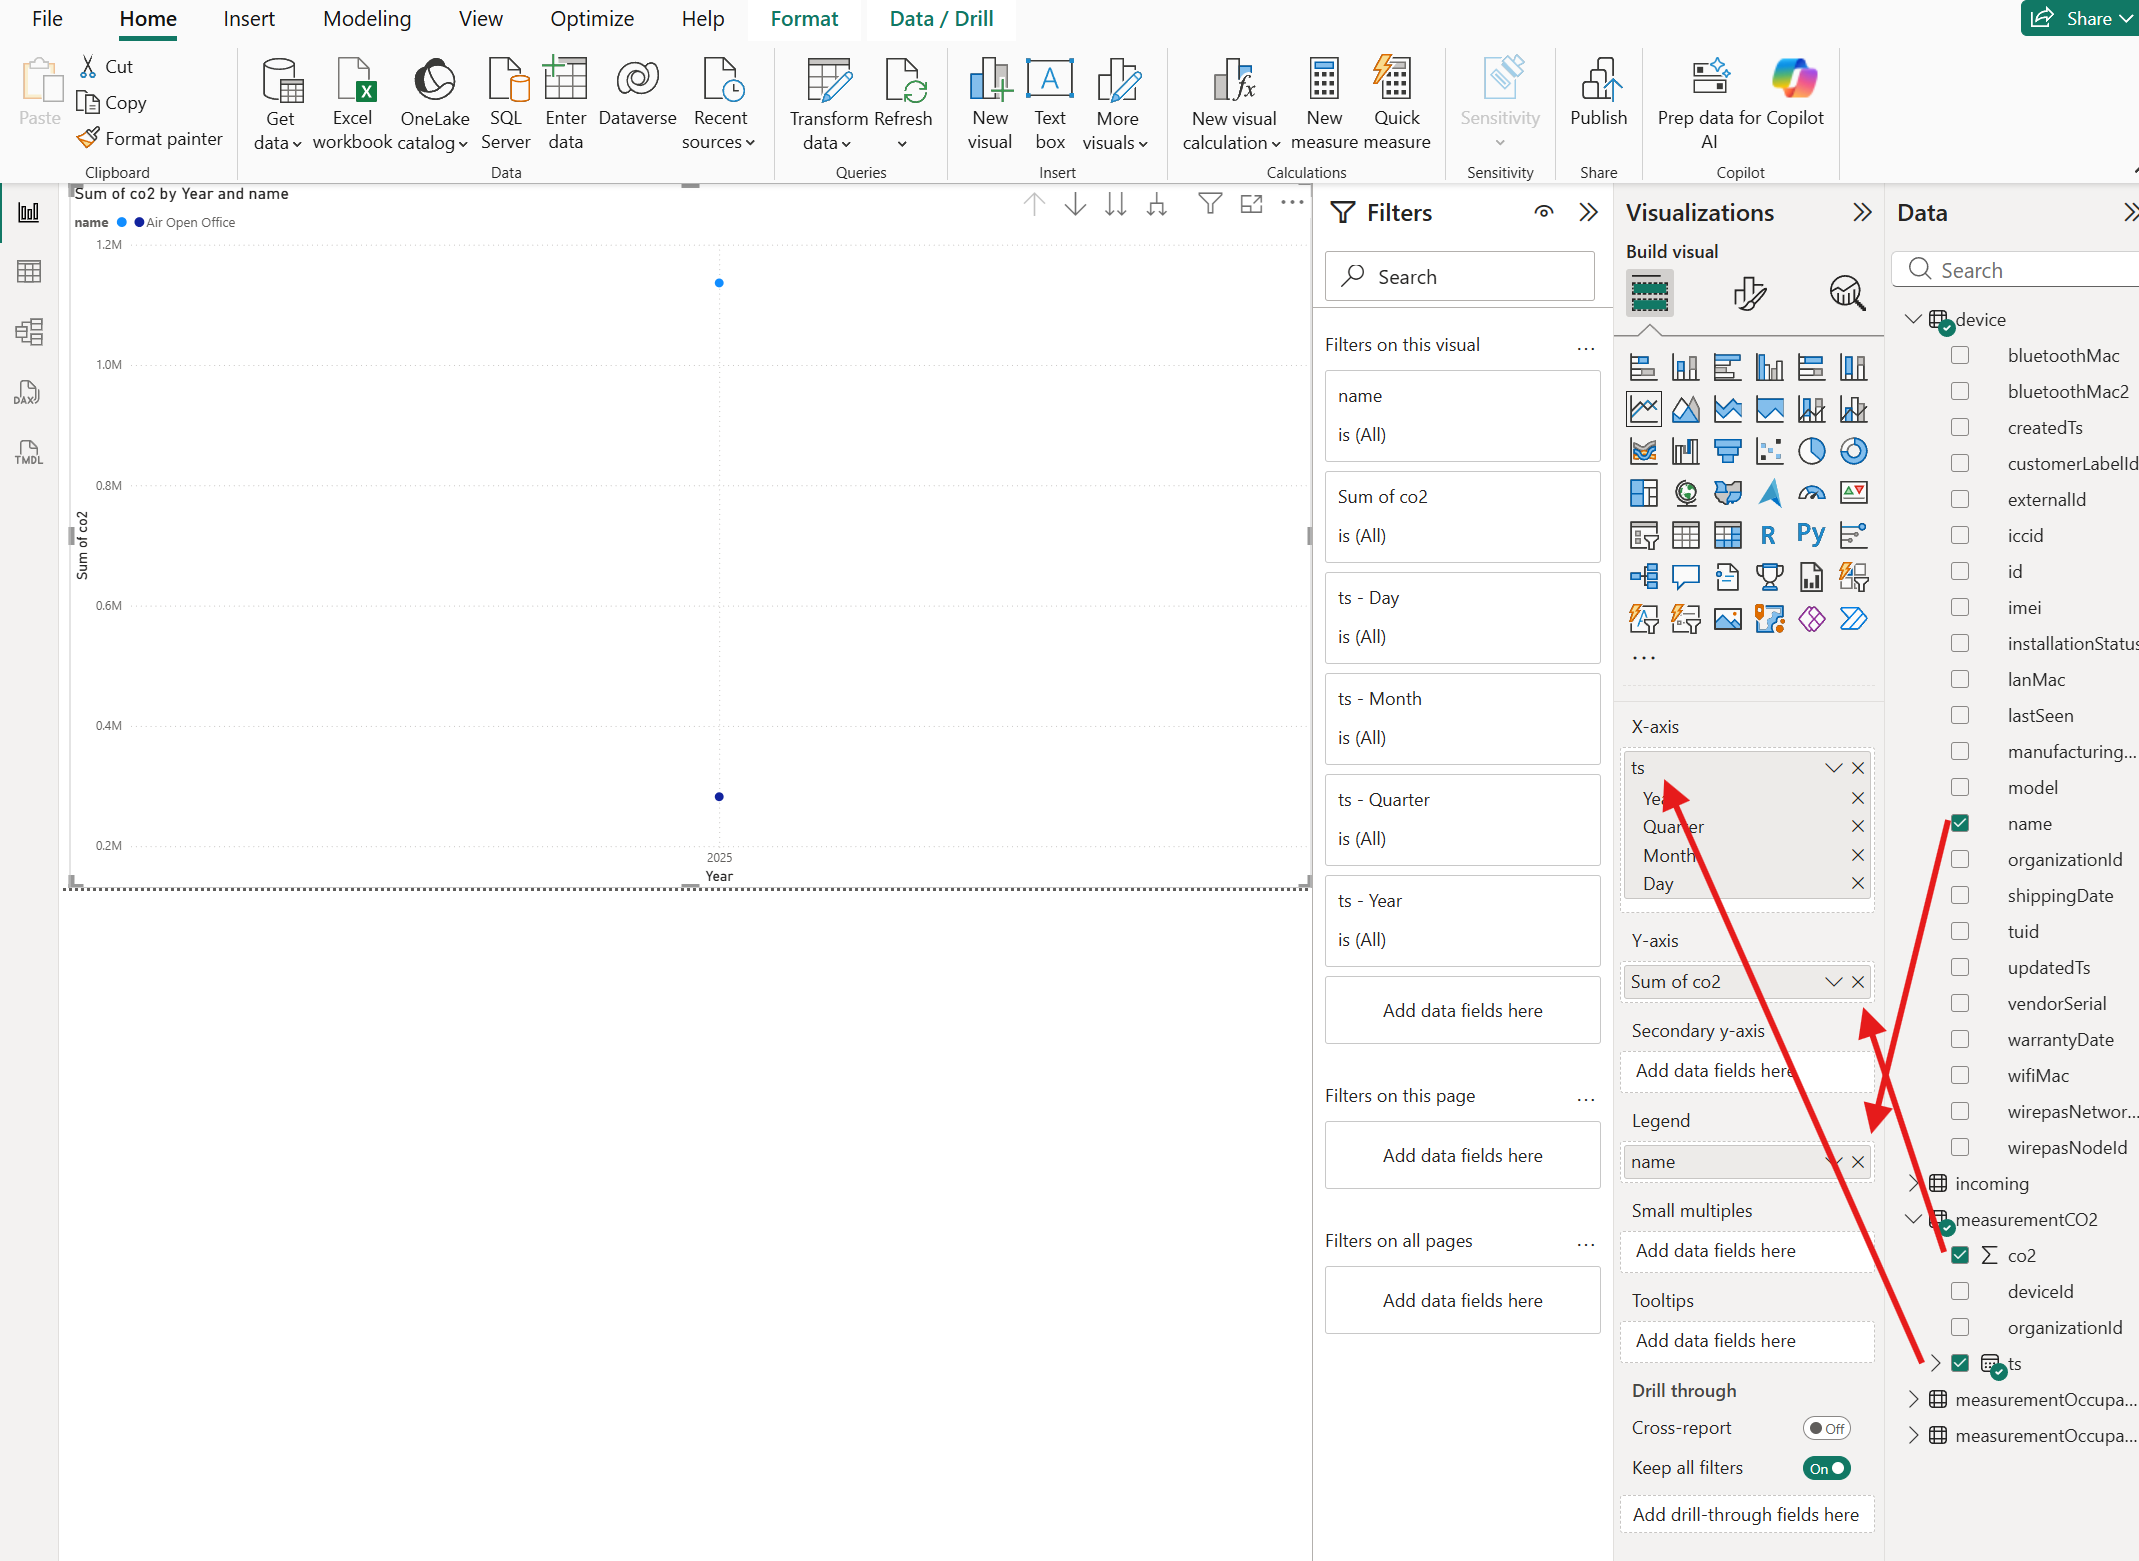
Change
tsfrom Date Hierarchy to the rawtsvalue using the dropdown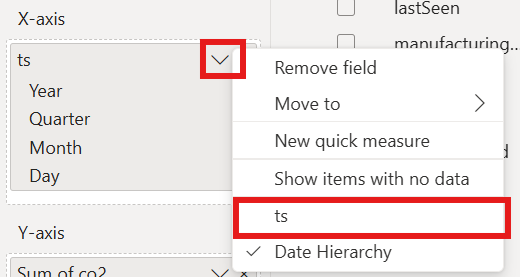
The chart displays CO2 readings per device over time
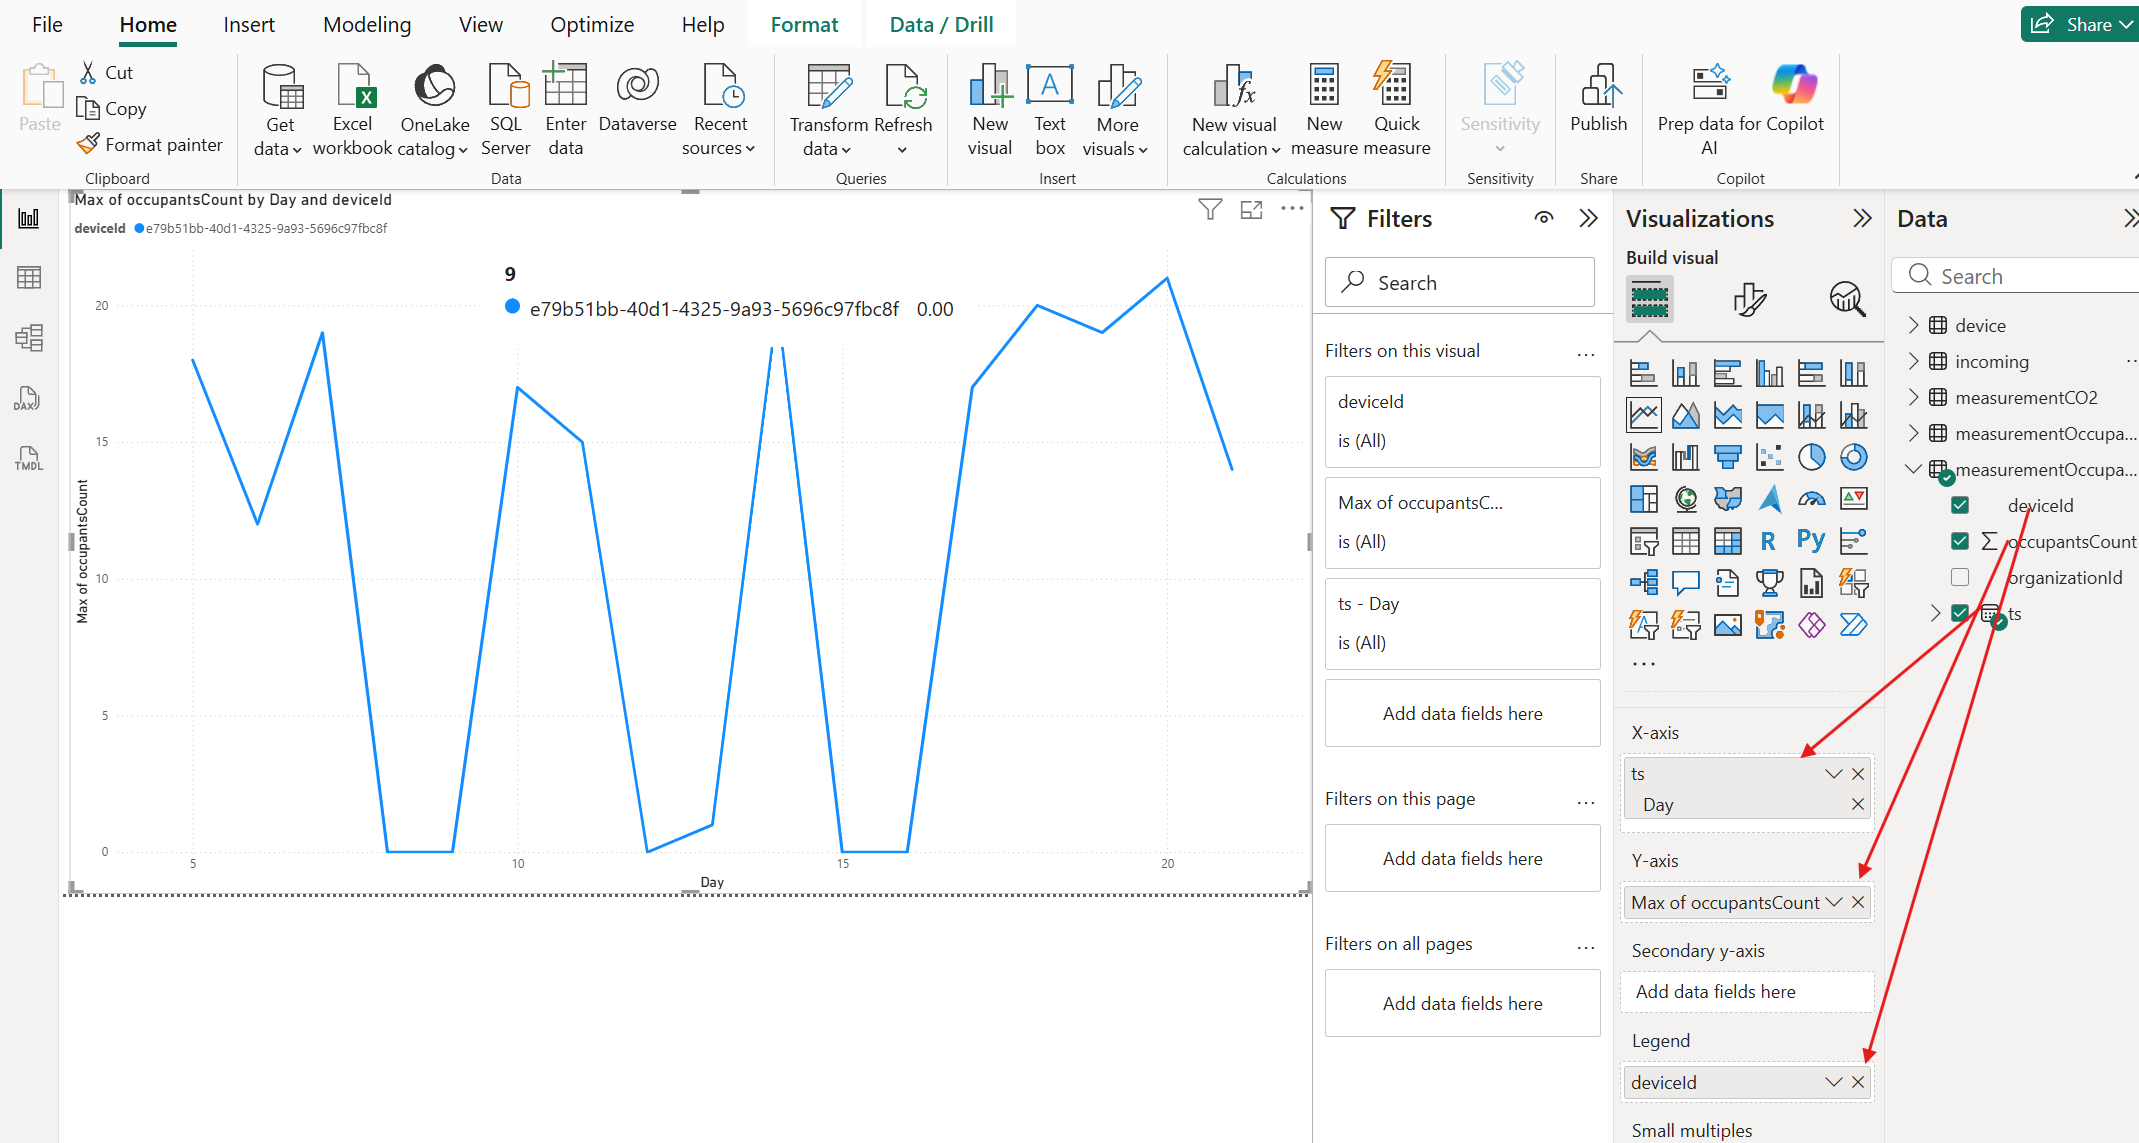
Occupants Count Bar Chart
Add a new page, select a Bar Chart
Drag
occupantsCount(use Max aggregation) andts(Day level from Date Hierarchy)This shows maximum occupants per day
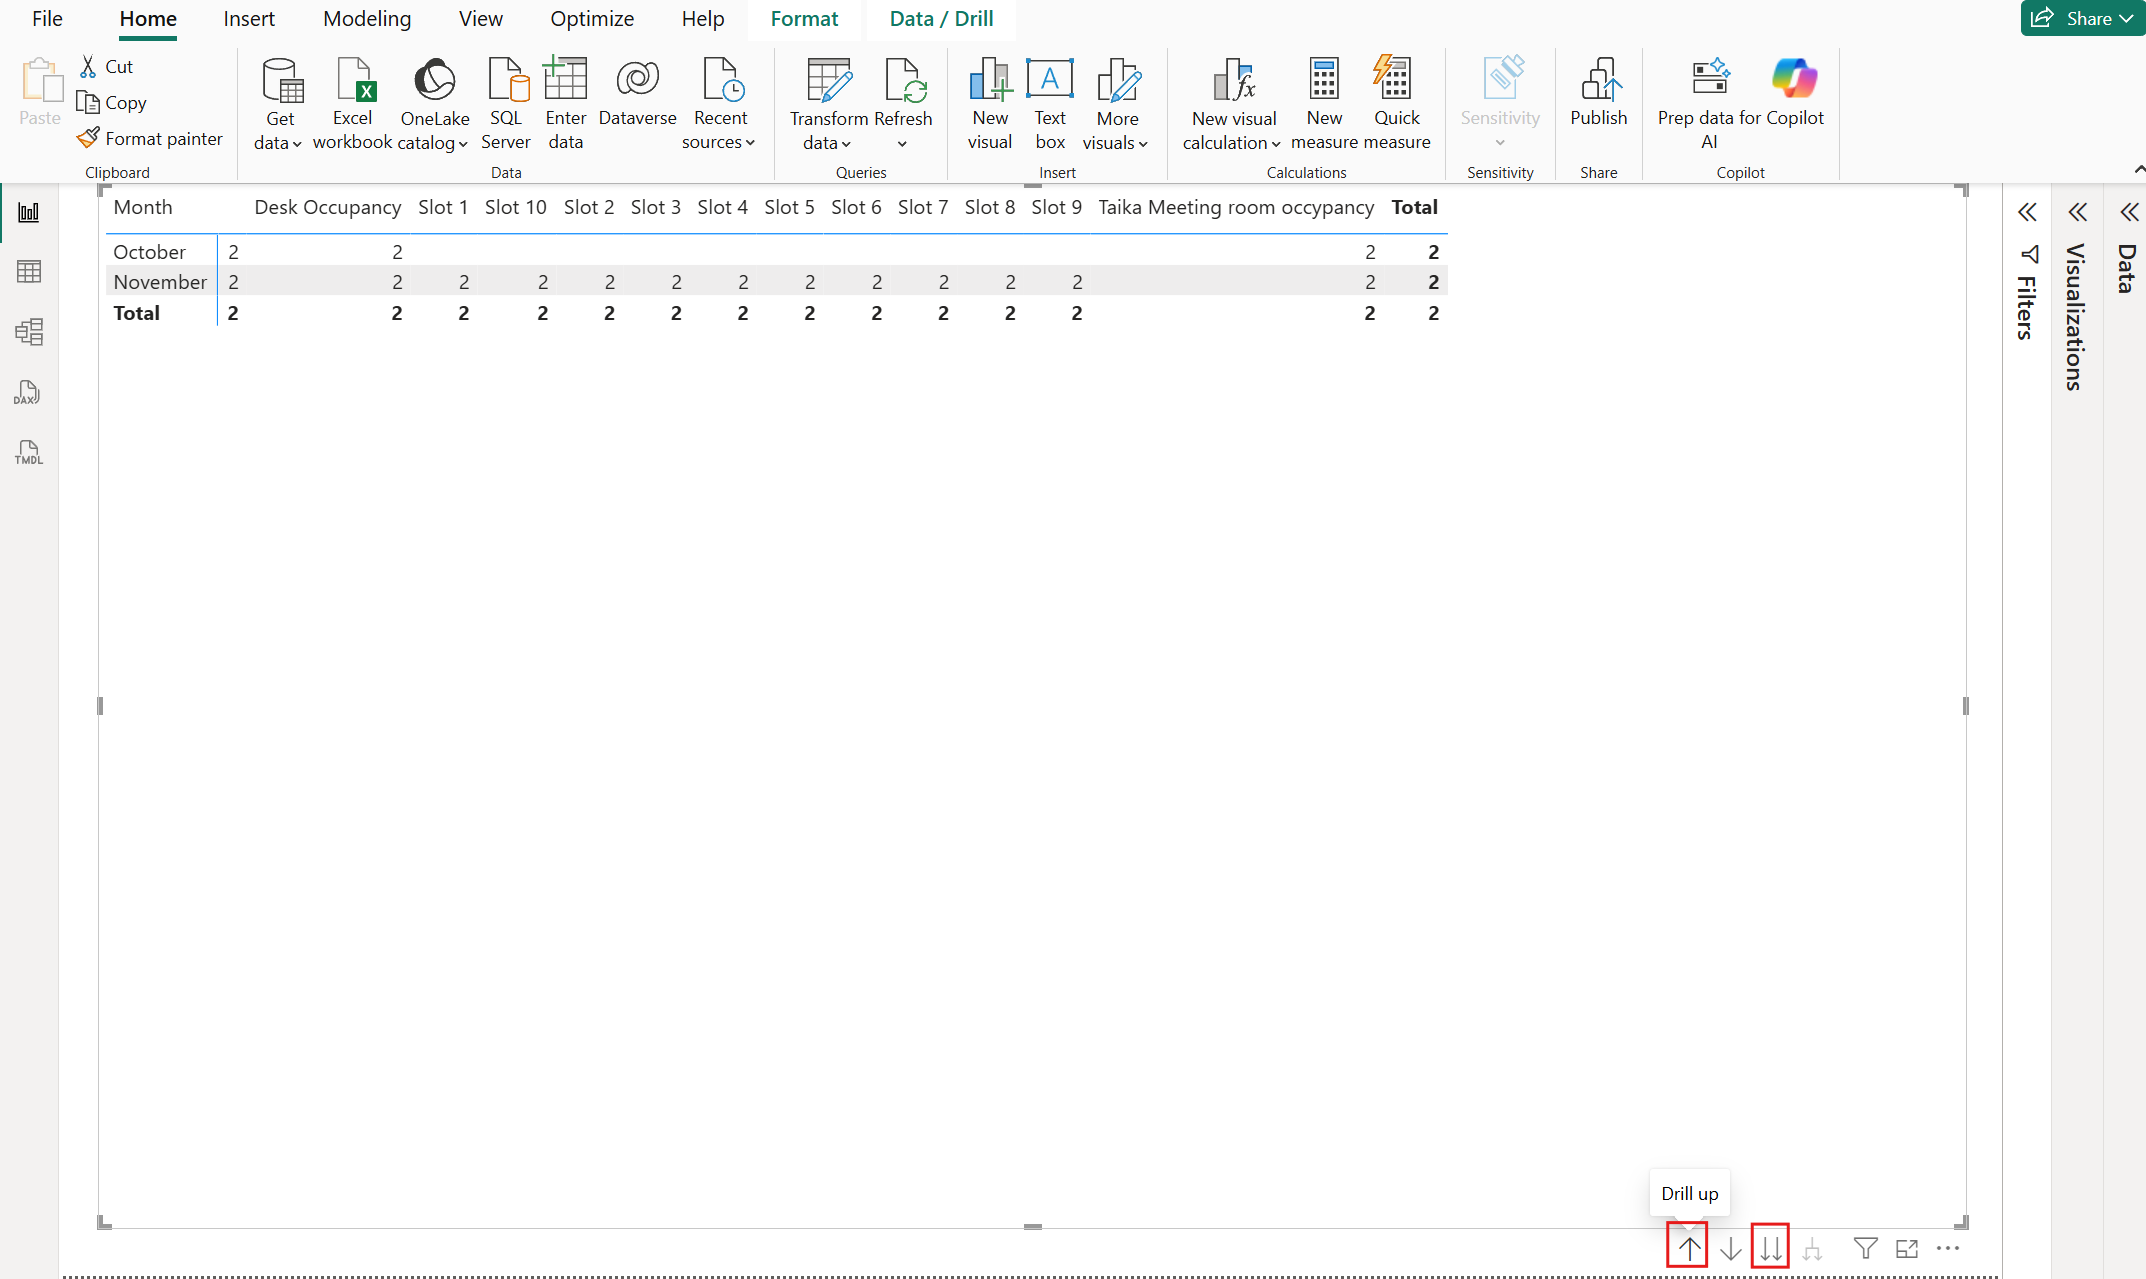
Occupancy Status Matrix
Add a new page, select a Matrix visual
Drag
name(device),status, andtsto the visual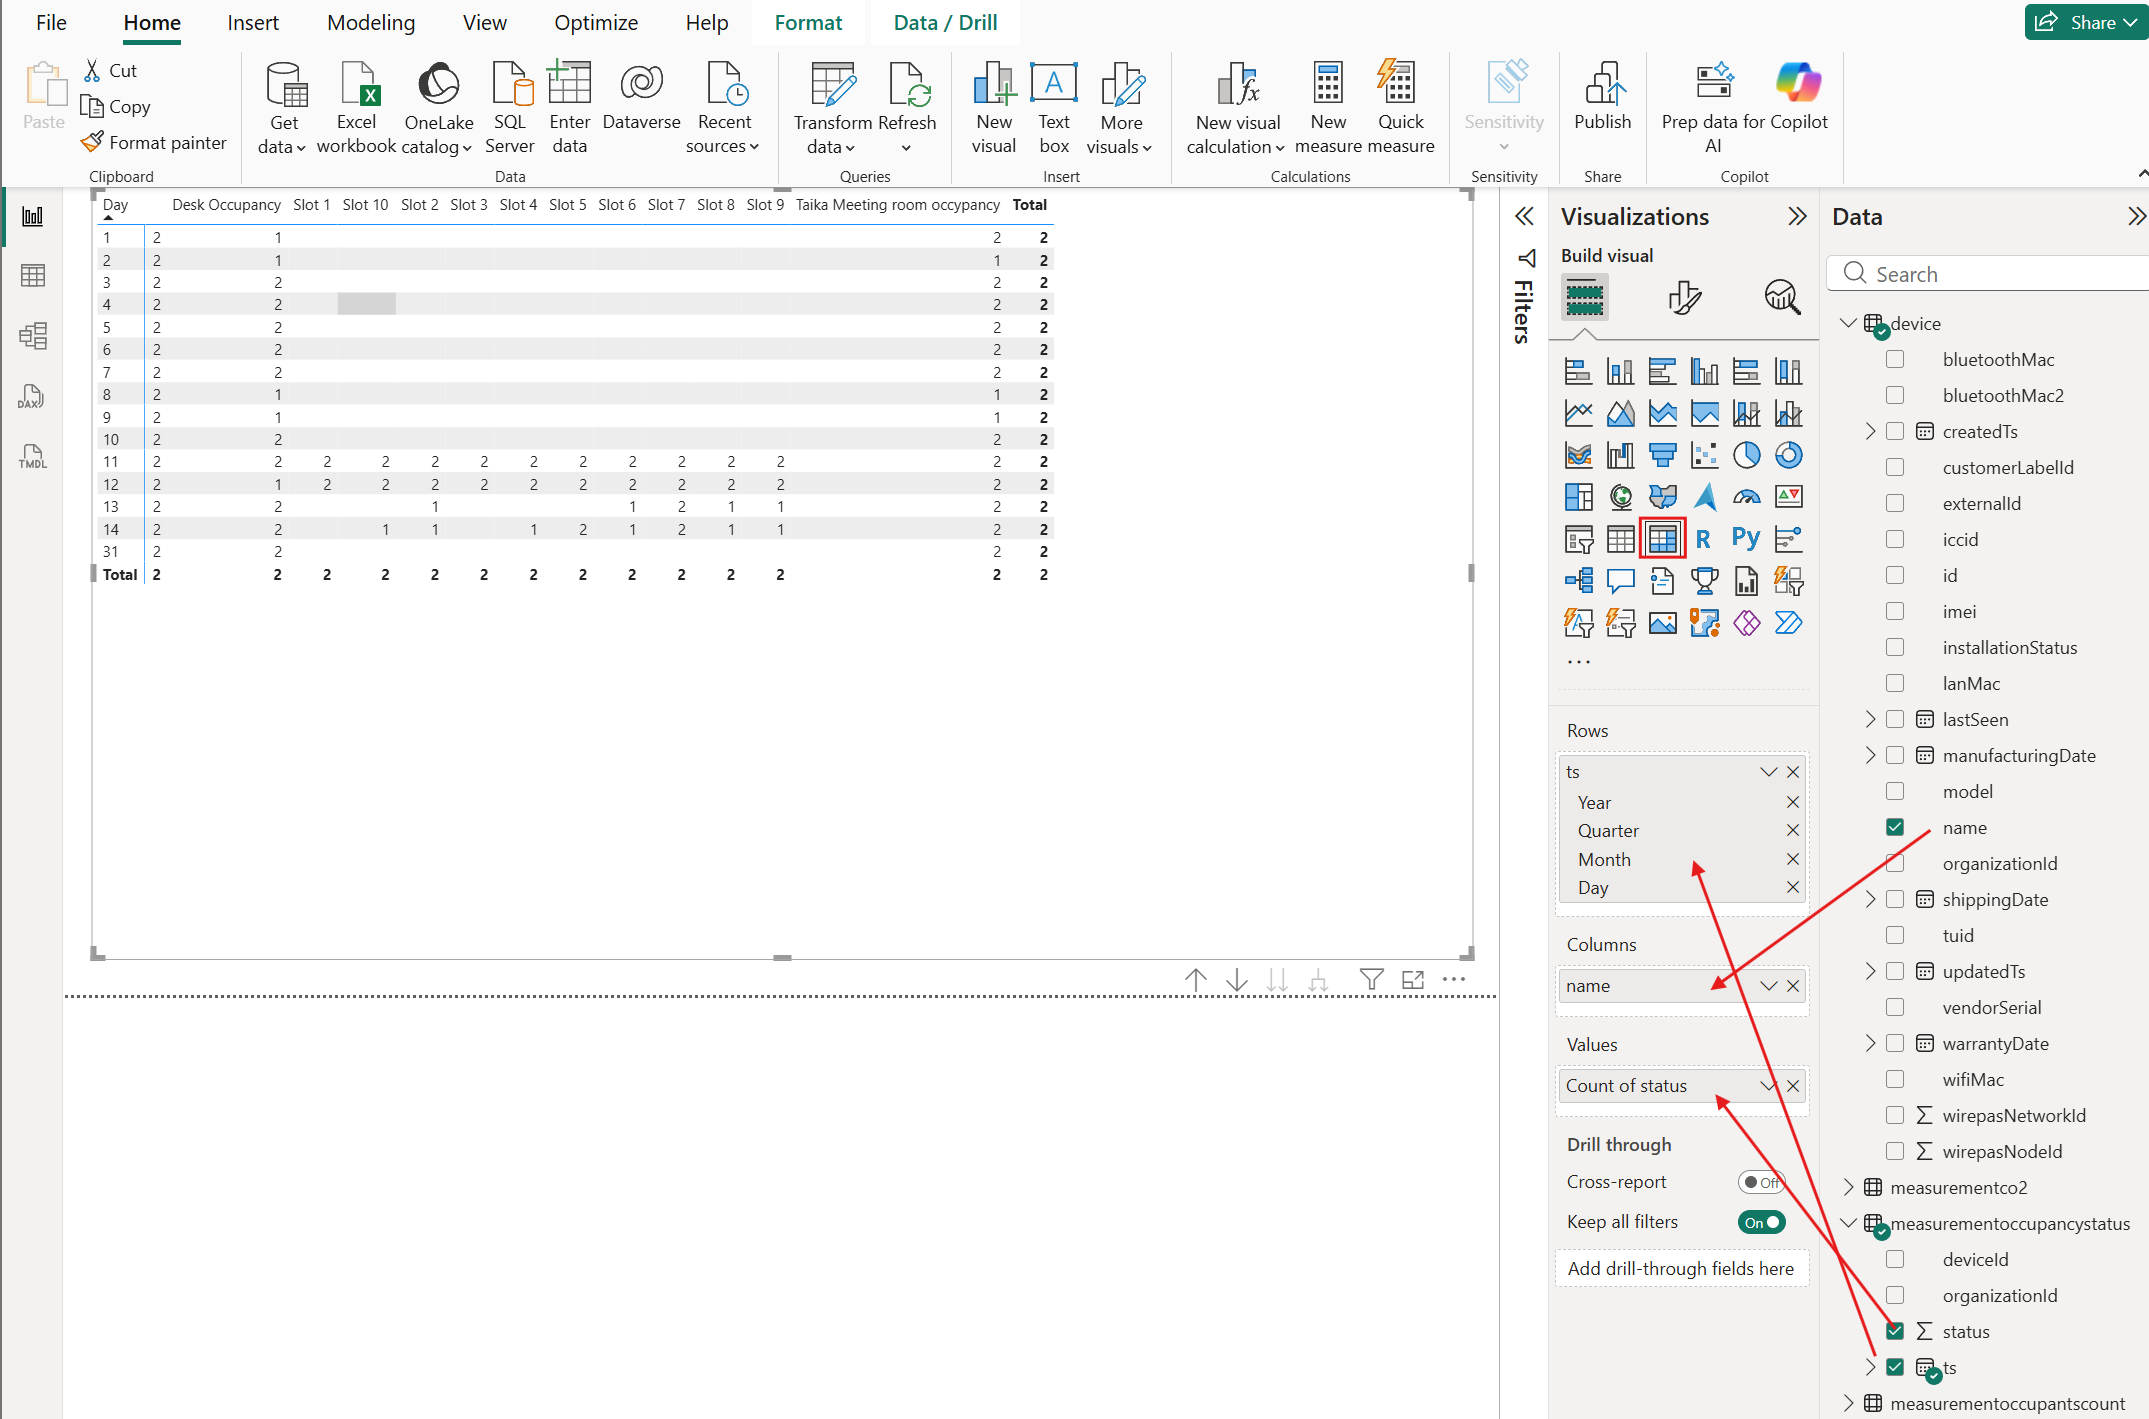
Use the level buttons to drill into the date hierarchy
Incremental Refresh
For large datasets, configure incremental refresh to avoid re-importing all historical data:
- Define
RangeStartandRangeEndparameters (DateTime type) in Power Query - Filter the
tscolumn using these parameters - Set the refresh policy (e.g., store 12 months, refresh last 3 days)
Key Columns
| Column | Type | Description |
|---|---|---|
ts | datetime | Measurement timestamp (UTC) |
deviceId | string | Device identifier |
id | string | Device ID (in device table) |
name | string | Device display name |
co2 | number | CO2 concentration (ppm) |
status | number | Occupancy status (0 = free, 1 = occupied) |
occupantsCount | number | Number of occupants detected |
See the Data API documentation for the full list of available measurement types and columns.
Next Steps
- Publish the report to Power BI Service for sharing
- Configure scheduled refresh in Power BI Service
- Add additional measurement types as needed
- Build custom dashboards for different stakeholder groups