Favorites and Recents
Favorites Dashboard
The Favorites tab is your personal dashboard for monitoring key device measurements at a glance.
Android
iOS
What Favorites Show
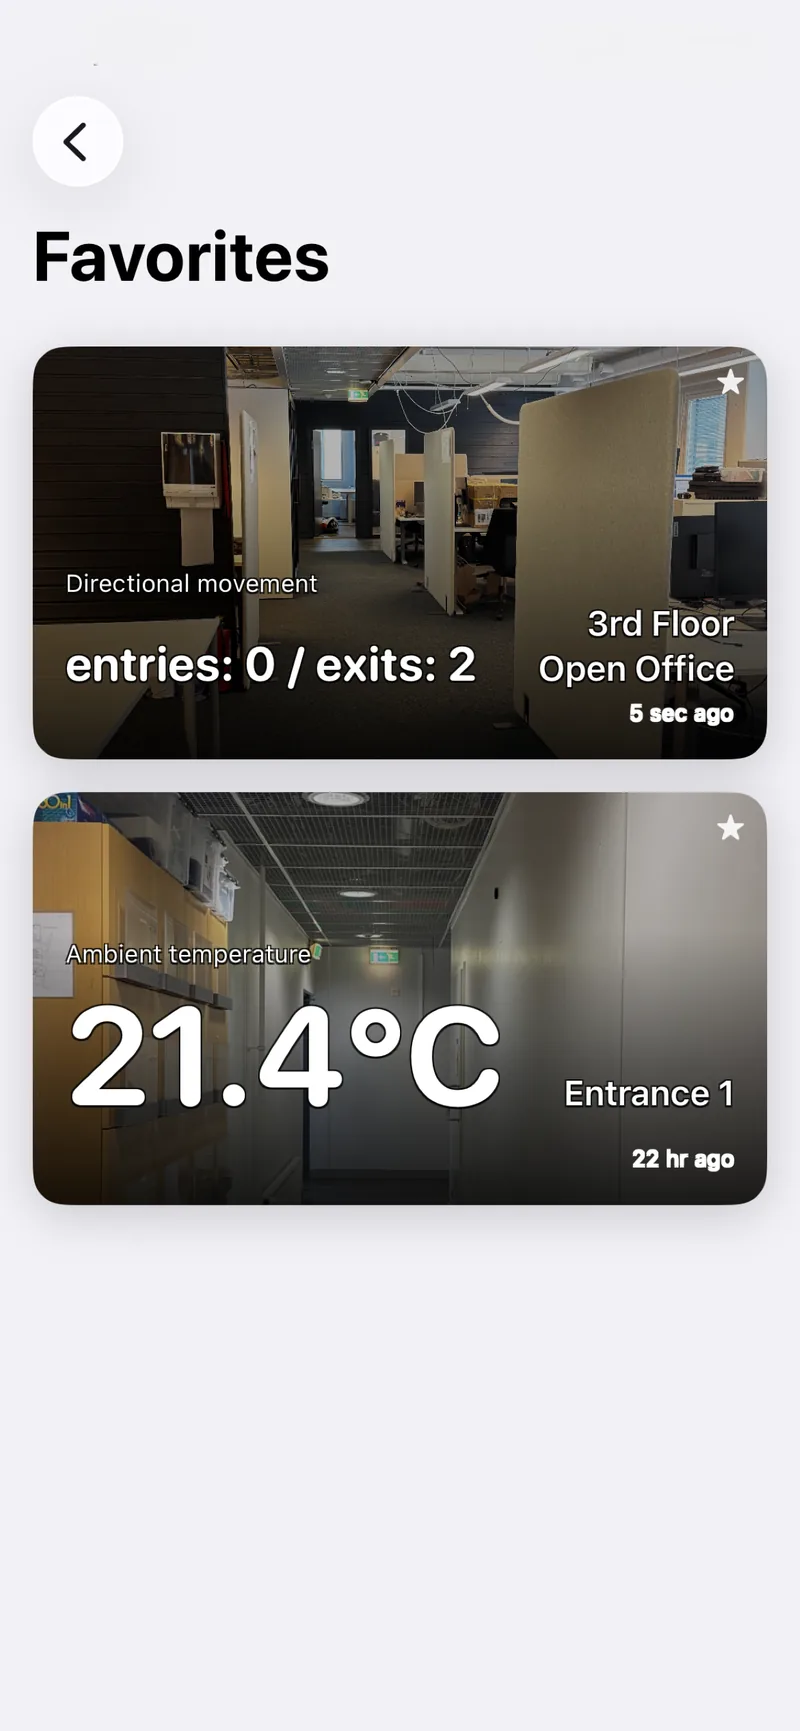
Each favorite card displays:
- Measurement name (e.g., “Ambient Temperature”)
- Device name
- Latest value with unit
- Relative timestamp (e.g., “2h ago”)
- Min/max values from the last 24 hours (shown with ↓ and ↑ arrows)
- Sparkline chart — a miniature trend line (when 3 or more data points are available)
- Device thumbnail — if a photo has been uploaded to the device
Favorites are displayed as cards in a grid layout.
Adding a Favorite
- Open a device from Search or Recents
- Scroll to the Measurements section
- Tap the star icon next to any measurement
- The measurement appears on your Favorites dashboard
Each favorite is a device + measurement combination. You can favorite multiple measurements from the same device, or the same measurement type across different devices.
Removing a Favorite
Tap the star icon again on the measurement in the Device Details screen to remove it from favorites.
Refreshing
Pull down on the Favorites screen to refresh all cards with the latest data.
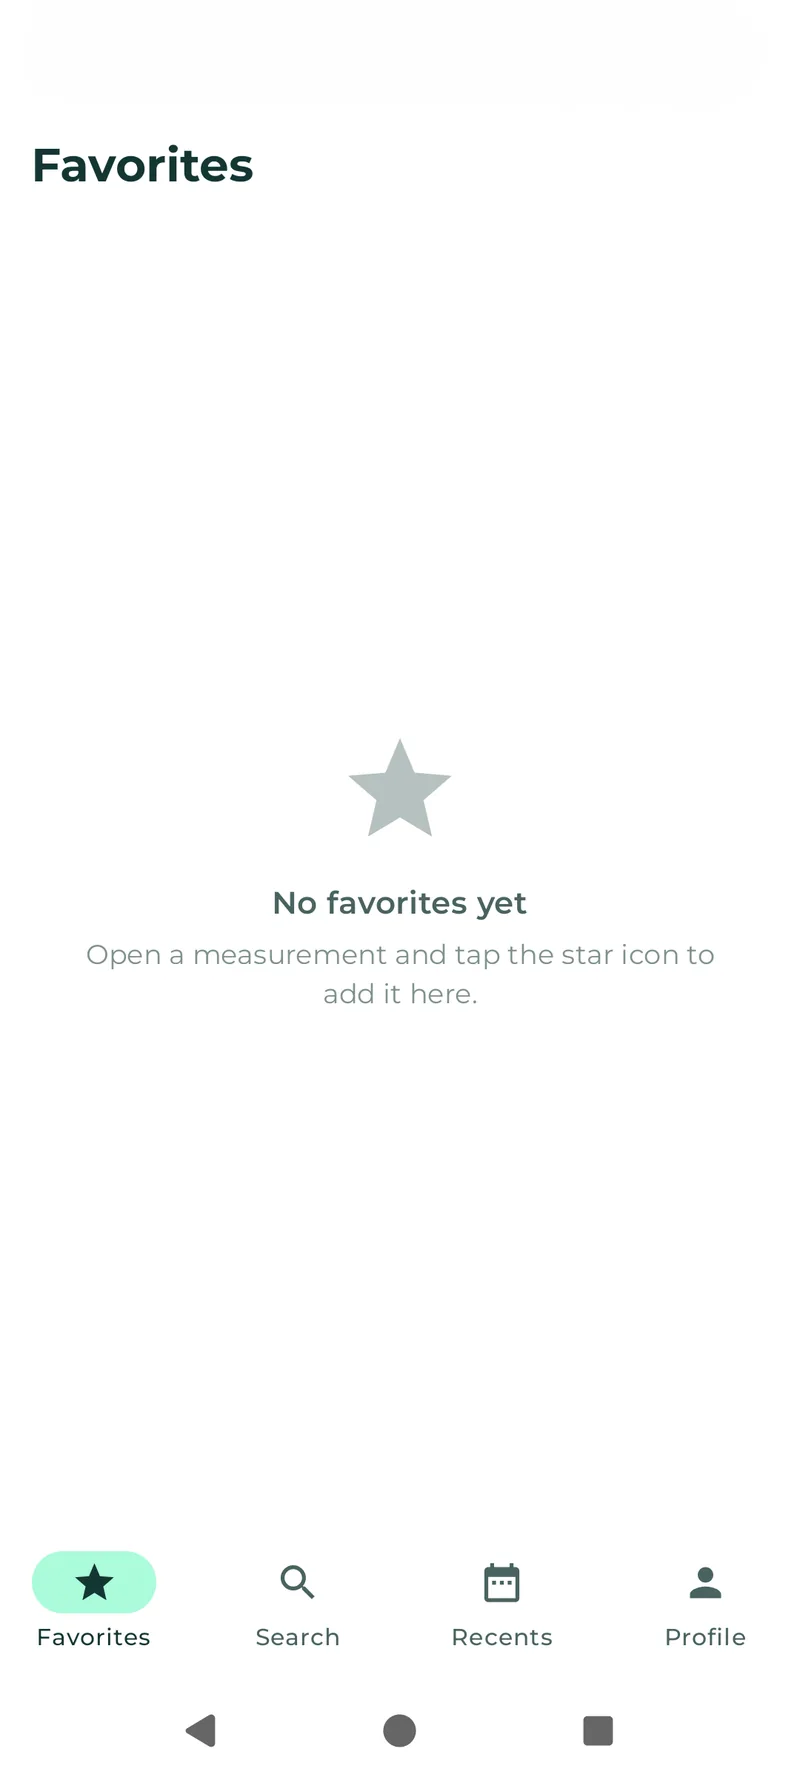
Empty State
When you have no favorites, the screen shows: “No favorites yet — Open a measurement and tap the star icon to add it here.”
Recent Devices
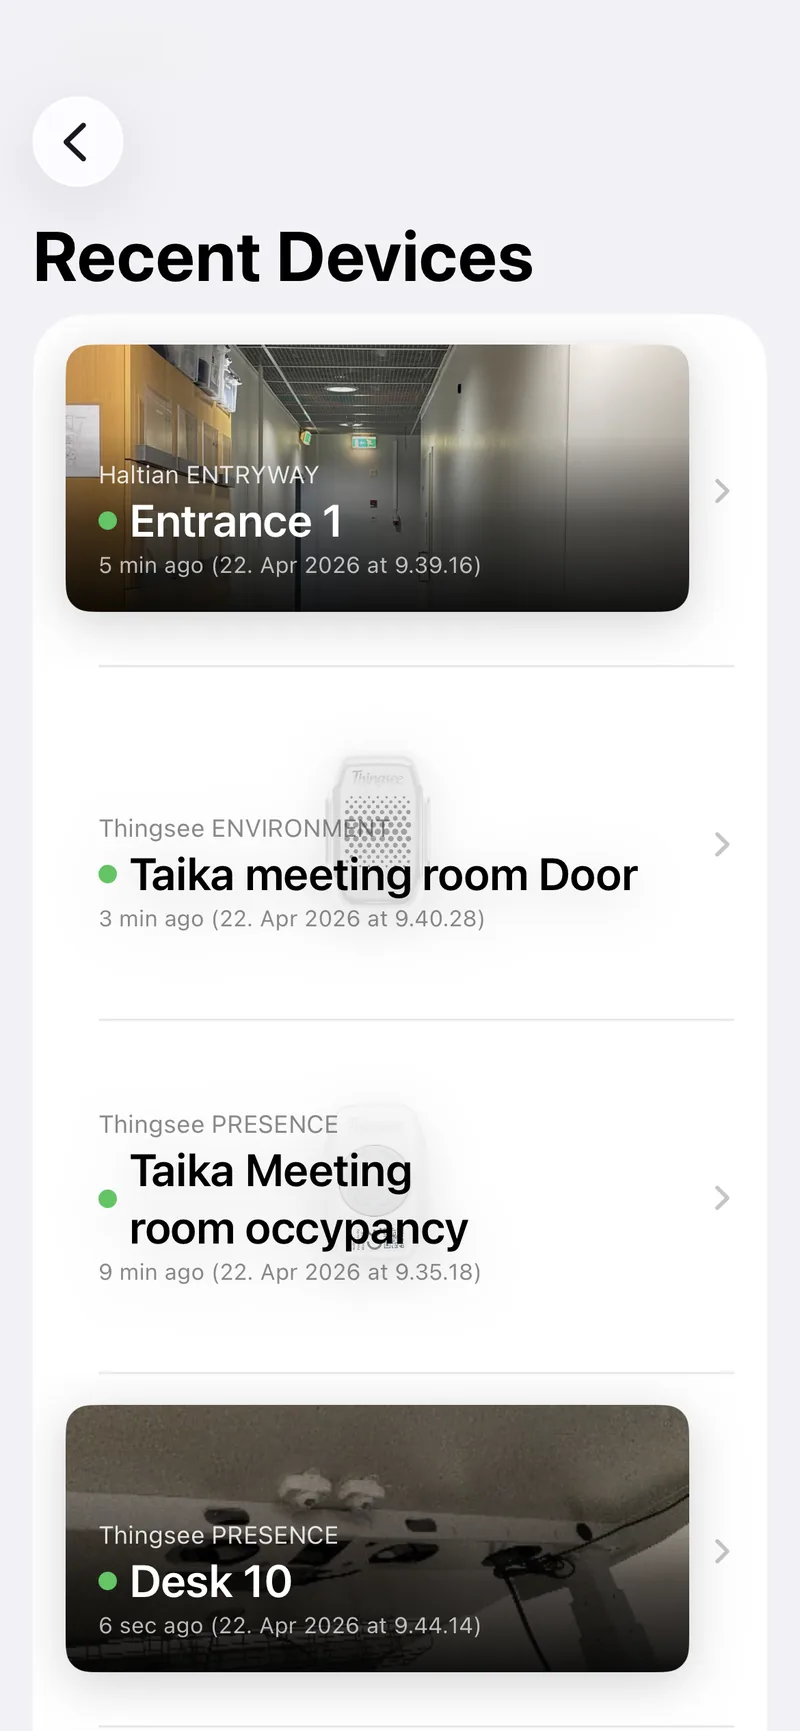
The Recents tab shows the last 10 devices you viewed, in reverse chronological order.
Android
iOS
What Recents Show
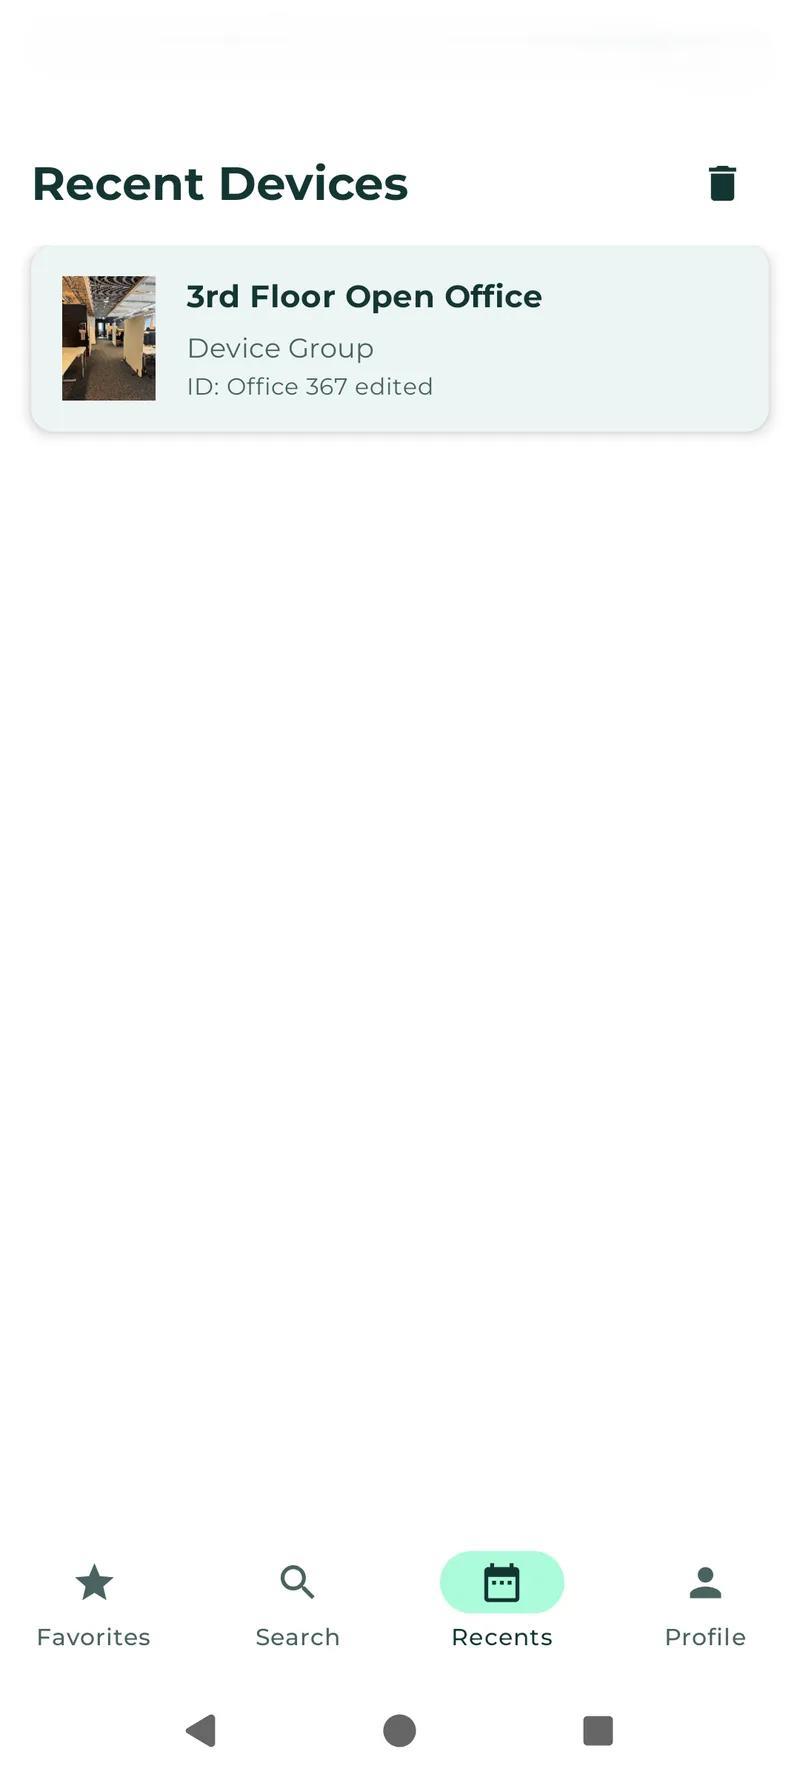
Each recent entry displays:
- Device name
- Device thumbnail (if available)
Tap any entry to go directly back to that device’s details.
Managing Recents
- Tap the clear all button in the header to remove all recent entries
- Recents are stored locally and scoped to your organization
Empty State
When you have no recents, the screen shows: “No recent devices — Devices you view will appear here.”